· 17 min read
Hope is (Mostly) Rational for Tottenham in 2026
The goalless start to the 2026 - 2027 Premier League season has left Spurs supporters swirling in a whirlpool of worry, apathy, cynicism, and indignation. Echoes of last year’s near-relegation and the prolonged underperformance of the past three seasons have started to instill a fear centered on the question gnawing at every Spurs supporter’s conscience: Is mediocrity the new norm? Following two consecutive 17th-place finishes and now finding themselves at 20th place in the league and freshly knocked out of the Carabao Cup, the precipice of relegation and chronic failure is starting to feel more like home than the state-of-the-art Tottenham Hotspur Stadium ever has.
Fans of football or soccer, for my fellow North American compatriots (I will be going with football henceforth), are notorious for reactionary and emotional outbursts following matches. Whether it be grounded in optimism or a transient nihilism, it is hard to escape the emotional pull of the sport and to also not assume the general sentiment of your fellow supporters. In a good run of form, this leads to elation and optimism; in times of frustration, this emotional pull often leads many into a recursive loop whereby negativity surrounding the club, team, manager, or specific players fuels continued, and heightened, criticism until something tangibly positive breaks the loop. But until that positive condition is met, a fixation on the negatives often subsumes more optimistic attitudes within the fan base.

For Tottenham, the fan base remains split on whether or not there is hope for the rest of the season. Roberto De Zerbi’s appointment at the tail-end of last season was a saving grace, and the busy Summer transfer window refreshed the minds of Tottenham supporters with a sense of positive bewilderment and confidence. But now that we find ourselves in 20th, the seed of doubt has reaffirmed its presence in the minds of all Tottenham supporters. The primary point of contention driving a wedge between the growing Tottenham pessimists and the dwindling Tottenham optimists is this: are we improving? For some, the season has already been written off. But for others, there is a growing competence in Roberto De Zerbi’s Tottenham Hotspur that subverts the results produced thus far. My personal position, as a lay spectator of the sport with no related credentials, is that there is real growth within the squad, albeit a slow growth.
Exploring Why
Many people who engage with football are quite casual about it. Even the hardcore football supporters who visit their club’s grounds every weekend often rely on the eye test to evaluate how well their team or a particular player(s) did on that day. This tendency is rooted in tradition and convenience but is prone to subjective bias. Statistical methods are a relatively new development in the sport and are seemingly in opposition to that tradition. Statistics introduced a sort of abstract nuance that was once taboo in football. For most, the basic metrics of goals scored, goals conceded, and possession are sufficient because they are so concrete and immediately available to the eye. The new metrics we see today are comparatively abstract and often espoused prima facie by pundits and ‘tacticos’ (i.e., amateur football tactical analysts on social media).
But it is undeniable that these statistical metrics are useful for providing comparable measures of performance; there has been a fast growing acceptance of more intricate metrics such as xG (i.e., expected goals). The stigma surrounding statistics will last for a long while, I think, but I believe most football fans now accept the value of statistics in football. It is through tracking these statistical metrics over time where can descriptively compare what is inferred from the eye-test.
Broadly speaking, we can group these statistical measures into four general categories reflecting the four primary parts of a match: those related to goalkeeping, those related to defending, those related to passing, and those related to attacking. There are, of course, other aspects to consider—such as the tactical setup of both teams, the specific players on the pitch, the general levels of either teams, pitch and weather conditions, where on the pitch shots are taken, etc.—but this will be more of an exploratory analysis to identify trends in the general areas where Tottenham may be improving or regressing. Hence, it is an important caveat and limitation of this post in that there are a vast number of variables that a more prescriptive analysis needs to consider, but will not be accounted for in the present analysis.
When the Spurs Go Marching In
First, an important note on the methodology. All of the data used were collected from two websites out of convenience: FotMob and Flashscore. Both of these websites provide match-to-match statistics but gather their own data from separate sources. FotMob primarily sources its data from Enetpulse, whereas Flashscore primarily sources its data from Opta. The nature of data collection means there is slight variance in the statistical metrics calculated by both platforms. Thus, to reduce inconsistencies in the data set, specific sets of metrics were selected from the same source. The exact metrics selected from each source can be found at the end of the post. Additionally, the match against Charlton Athletic was excluded due to the wider disparity in overall squad level.
The data set overall consists only of six matches, meaning the sample size is very small (13.16% of the entire Premier League season) relative to the entire potential data set of 38+ matches. It is important to take any assertions and plots with caution. With such a small sample size, real performance patterns will not be fully reflected in the data present and large changes in a given metric will heavily influence influence the overall trend of said metric. It is best to treat the following data as a general framework for thinking about what is troubling Tottenham hitherto, and not as a predictive model for how well Tottenham will do. And it cannot be stressed enough that there will virtually always be several other factors and metrics at play when trying to translate statistical metrics to tactical play, most of which are not presented here. Context is key to building the fuller picture.
Goalkeeping May Shed an Important Light
A Defence of the Defence
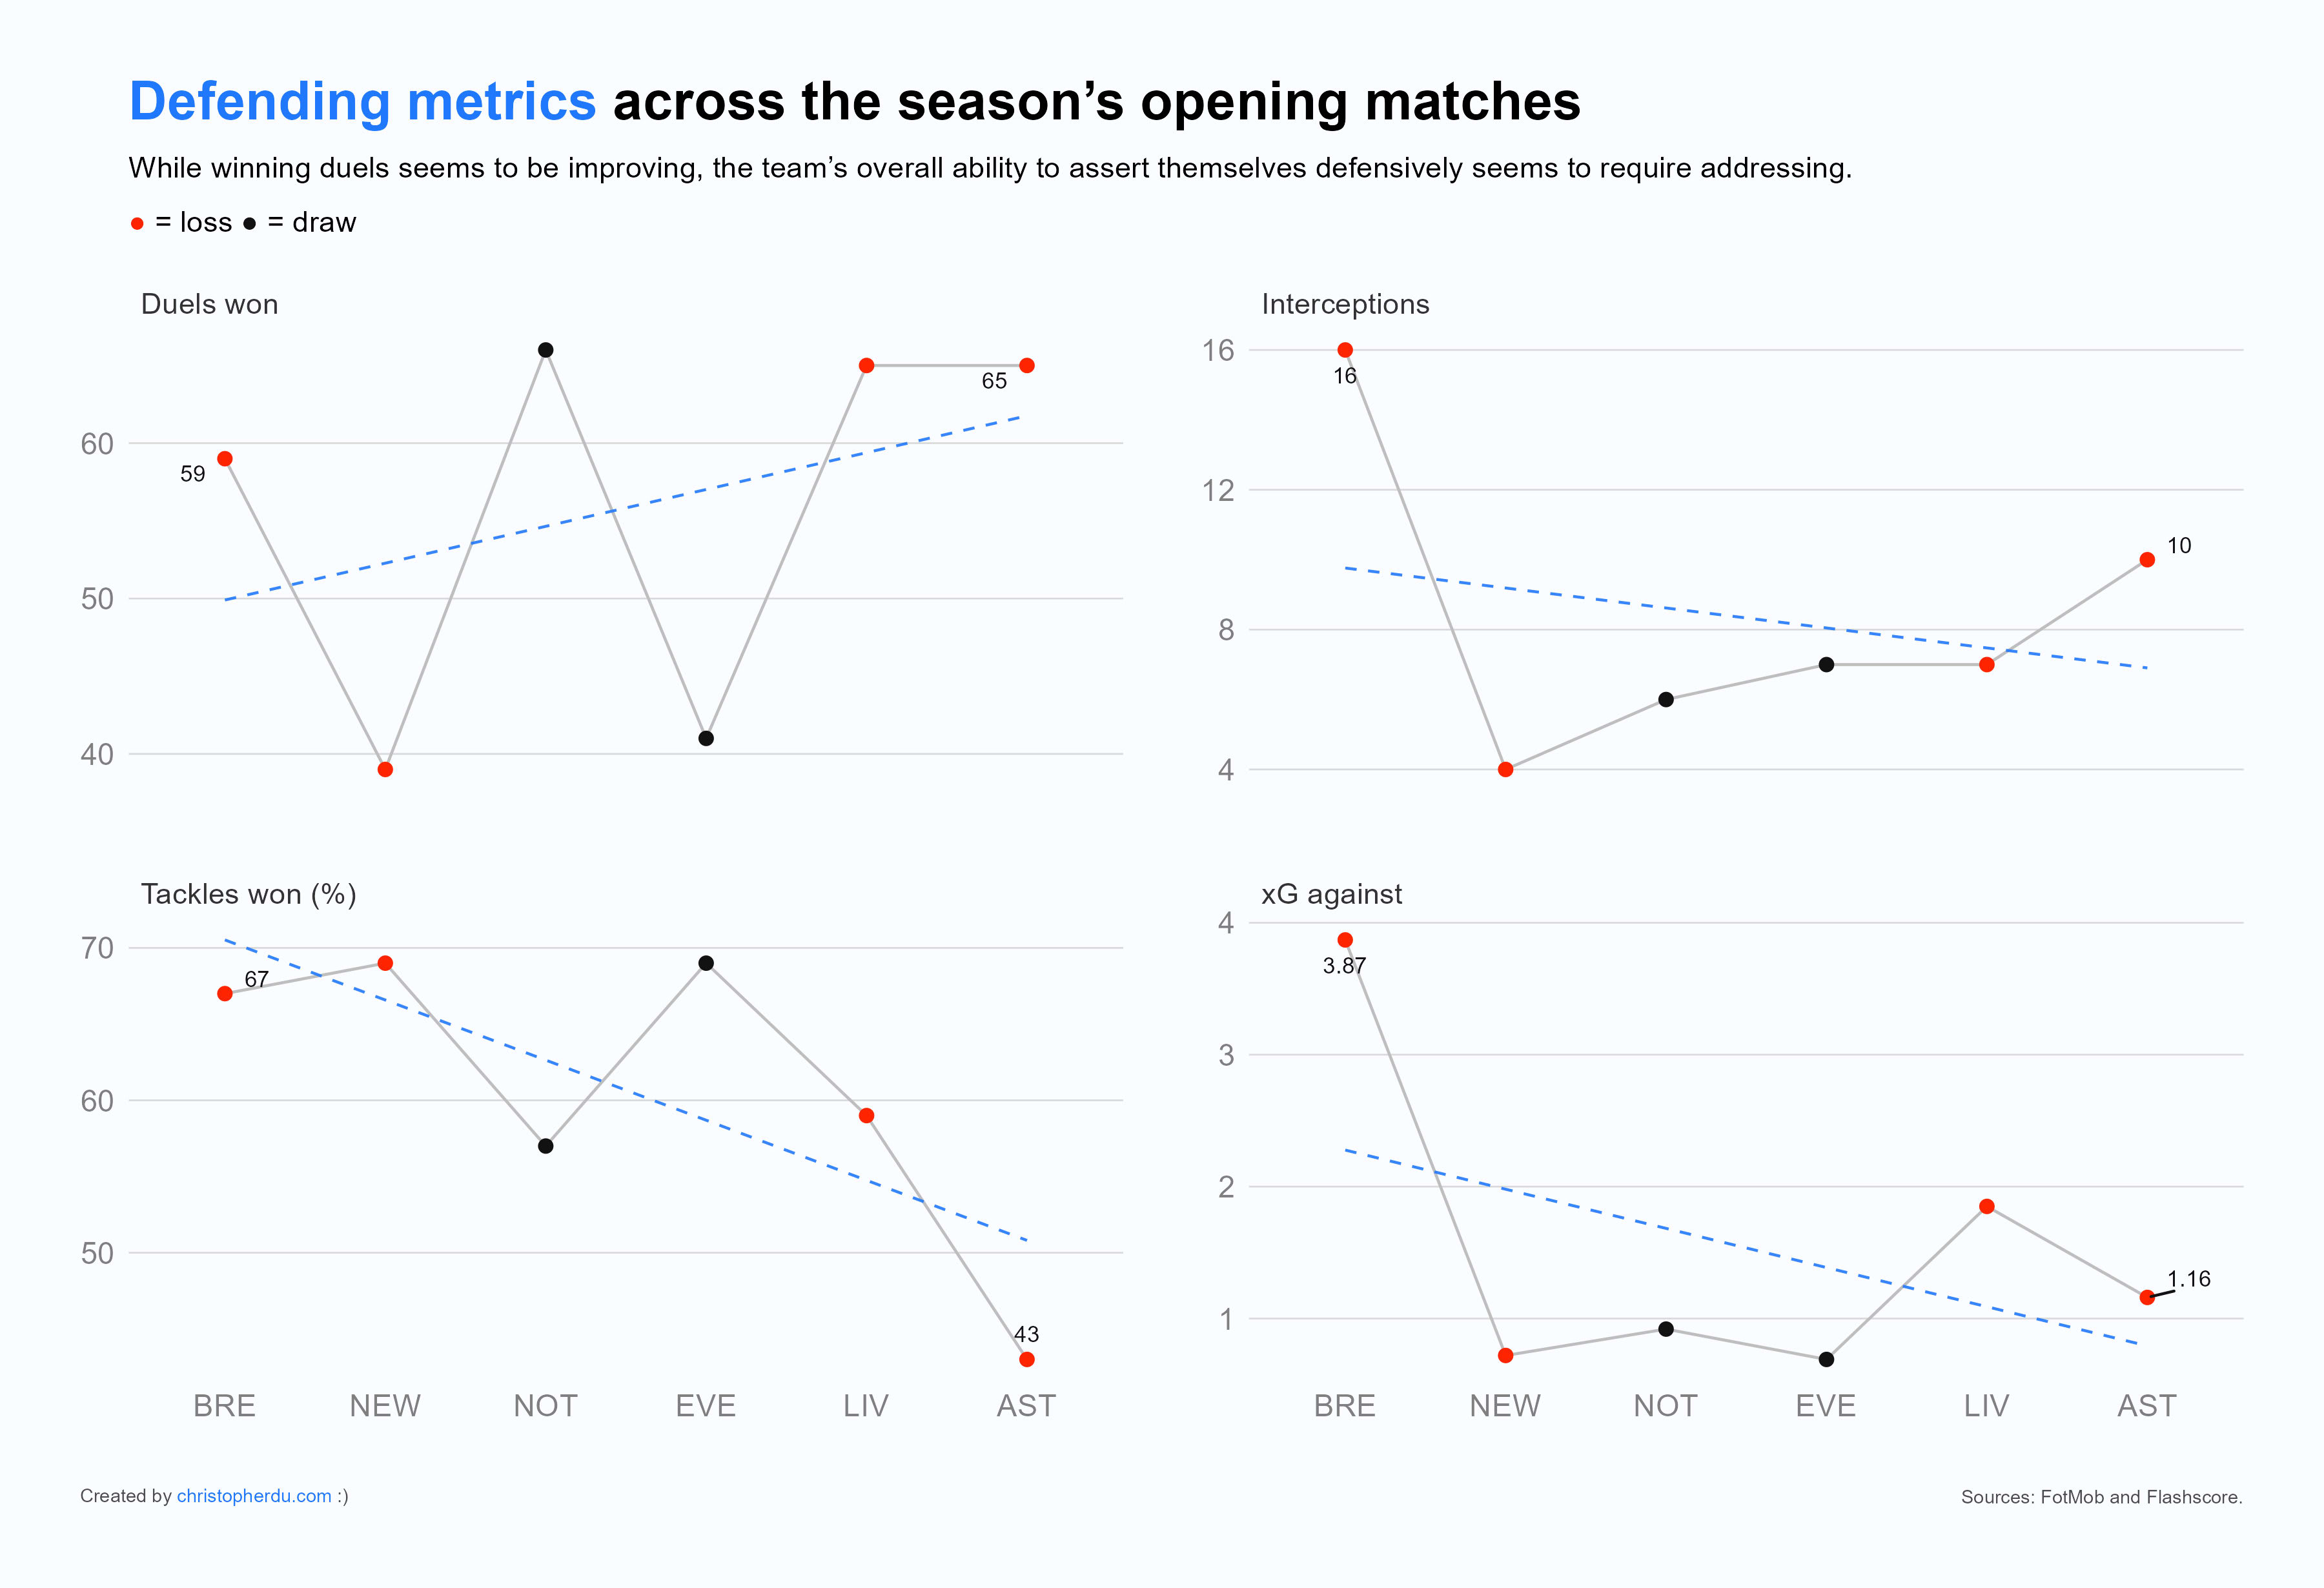
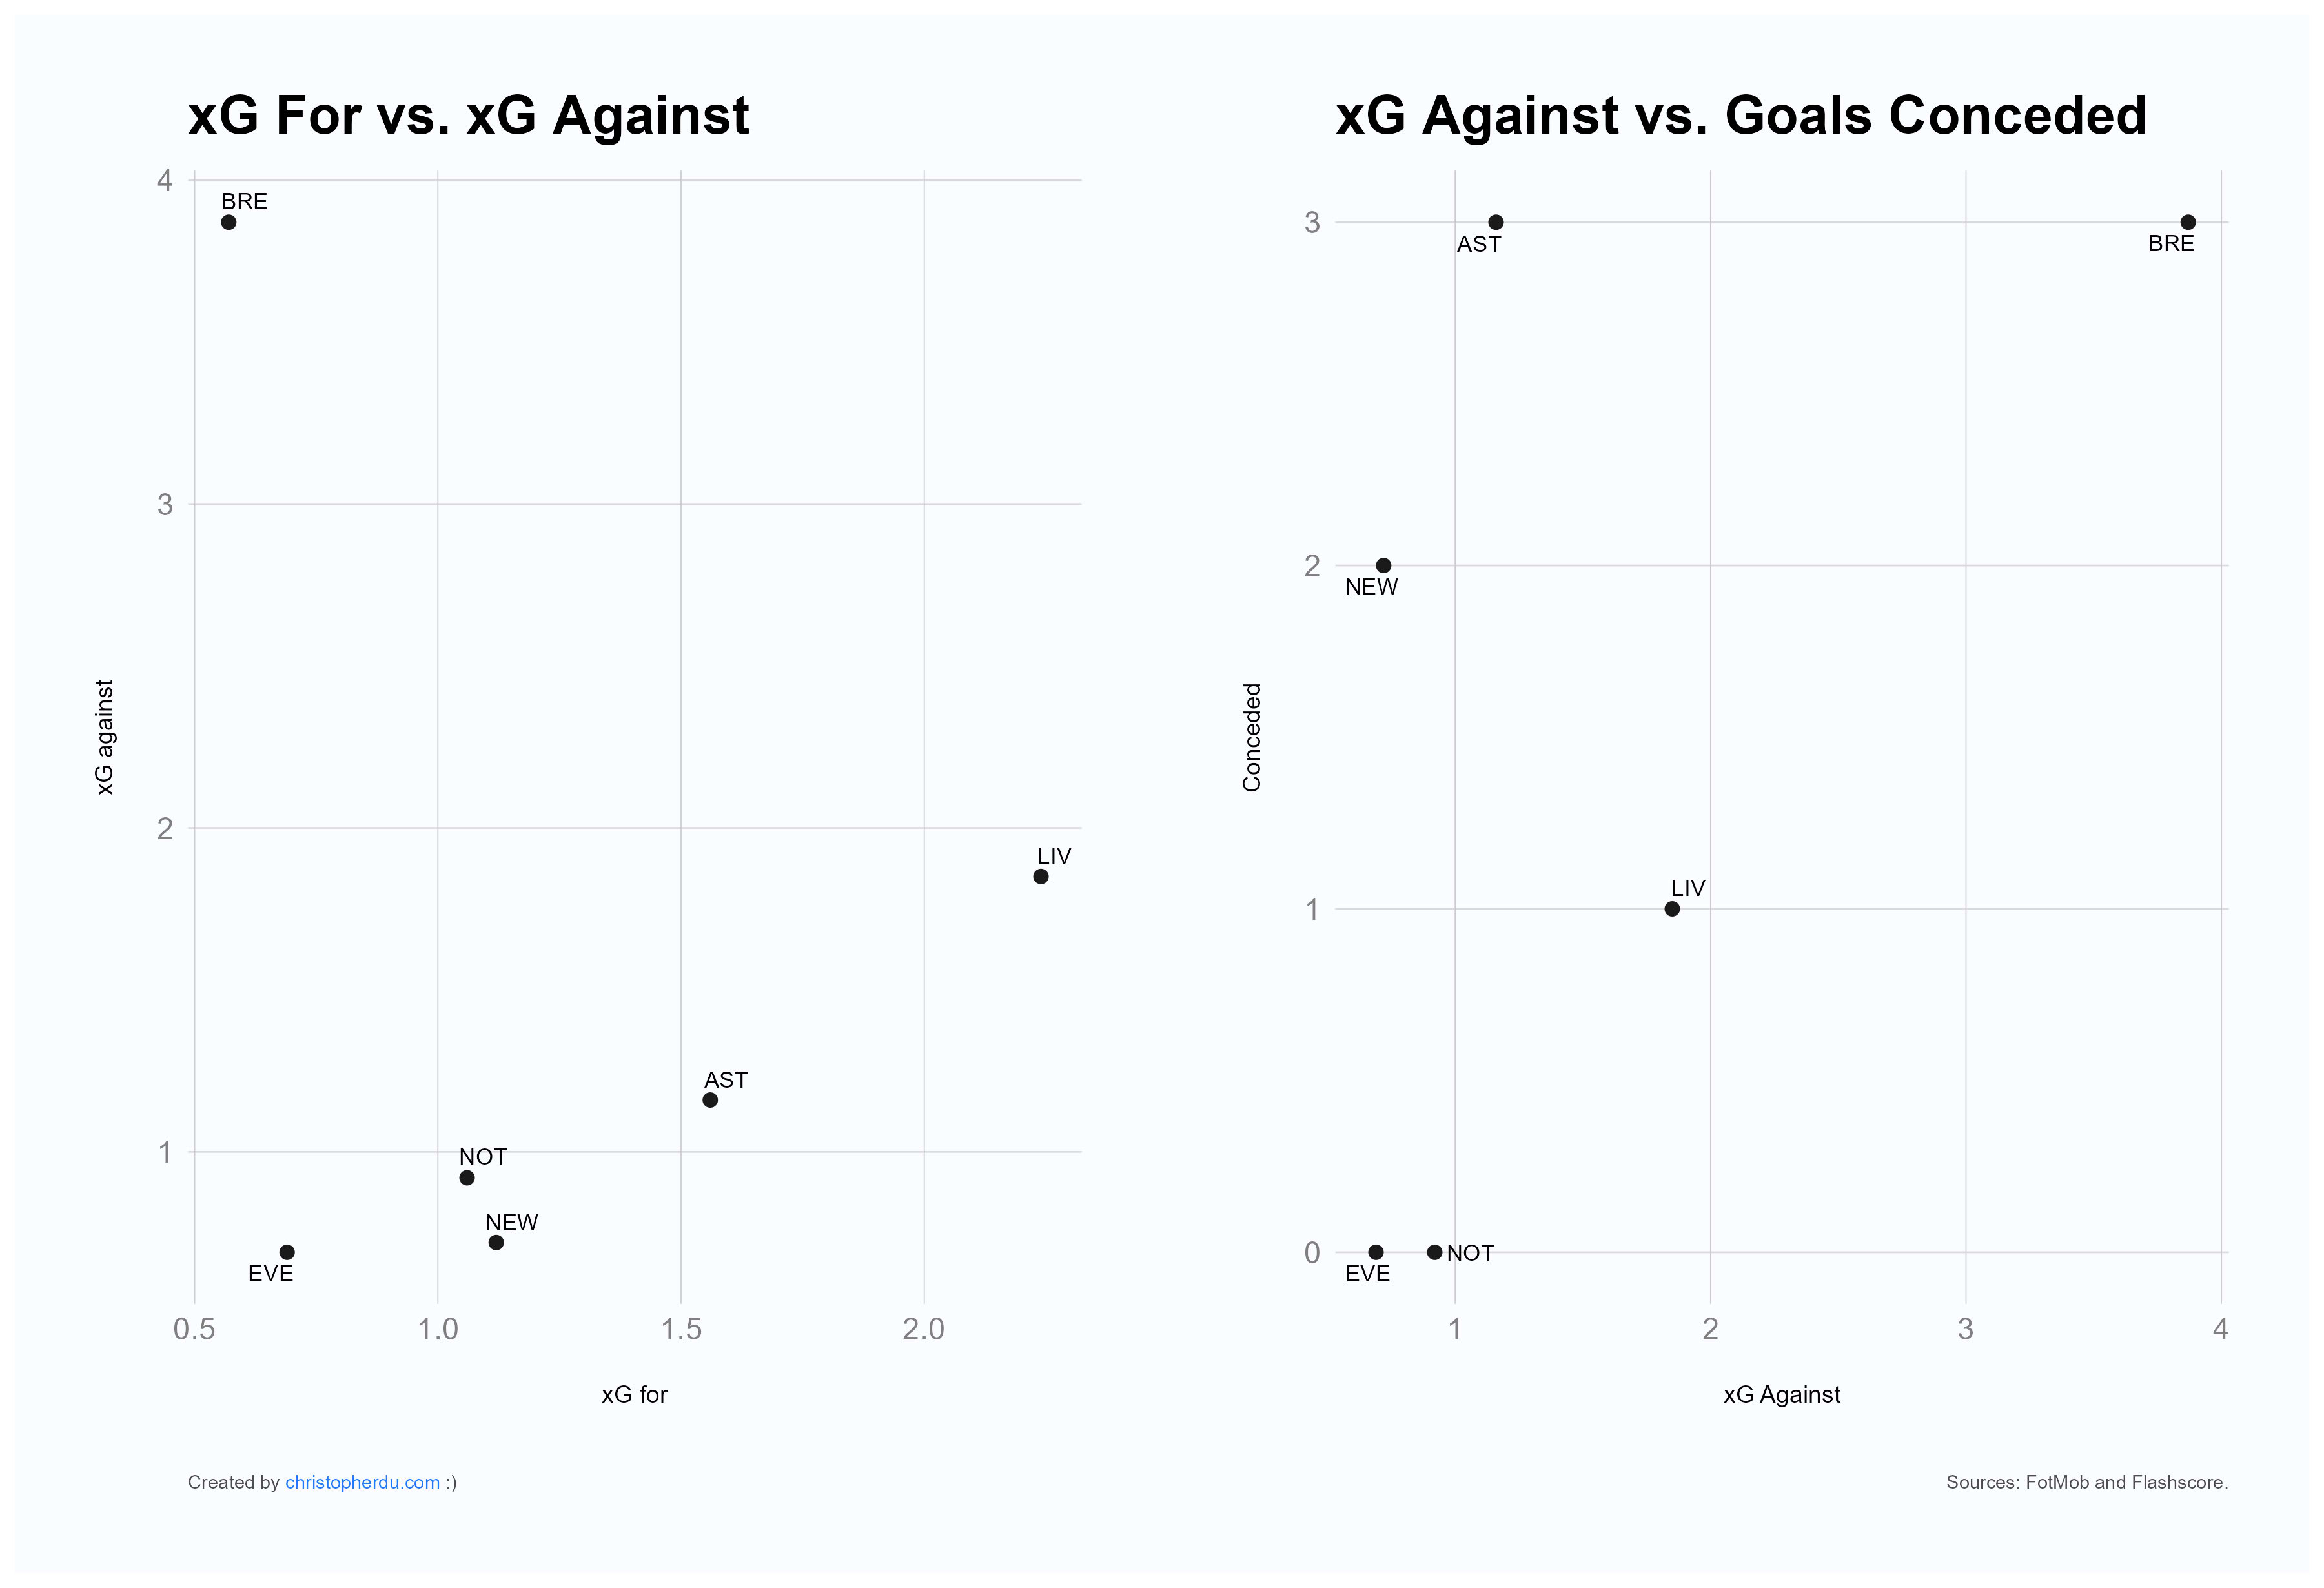
It is difficult to say with more confidence whether the defence is truly progressing. Regardless of the goals scored against Tottenham thus far, the trends of the above metrics may be showing an underlying improvement which may be overshadowed, or perhaps overcome may be more appropriate, by tactical decisions and a “slow start”. In comparing xG for and xG against above, one interpretation that could be made is that defence may be deferred in favour of empowering the offence—an attack-minded tactical structure. The results we have seen through the season do not produce much support for this approach; trade-offs and balancing risk and reward are intrinsic to football, but a coach’s approach to football becomes problematic when risk fails to produce the rewards that offset the costs of taking risks. But this pattern can likely be explained by several factors and interpreted through several angles. Another prominent one may be that Tottenham were simply chasing goals in these games, giving rise to an approach that is much more attack-minded.
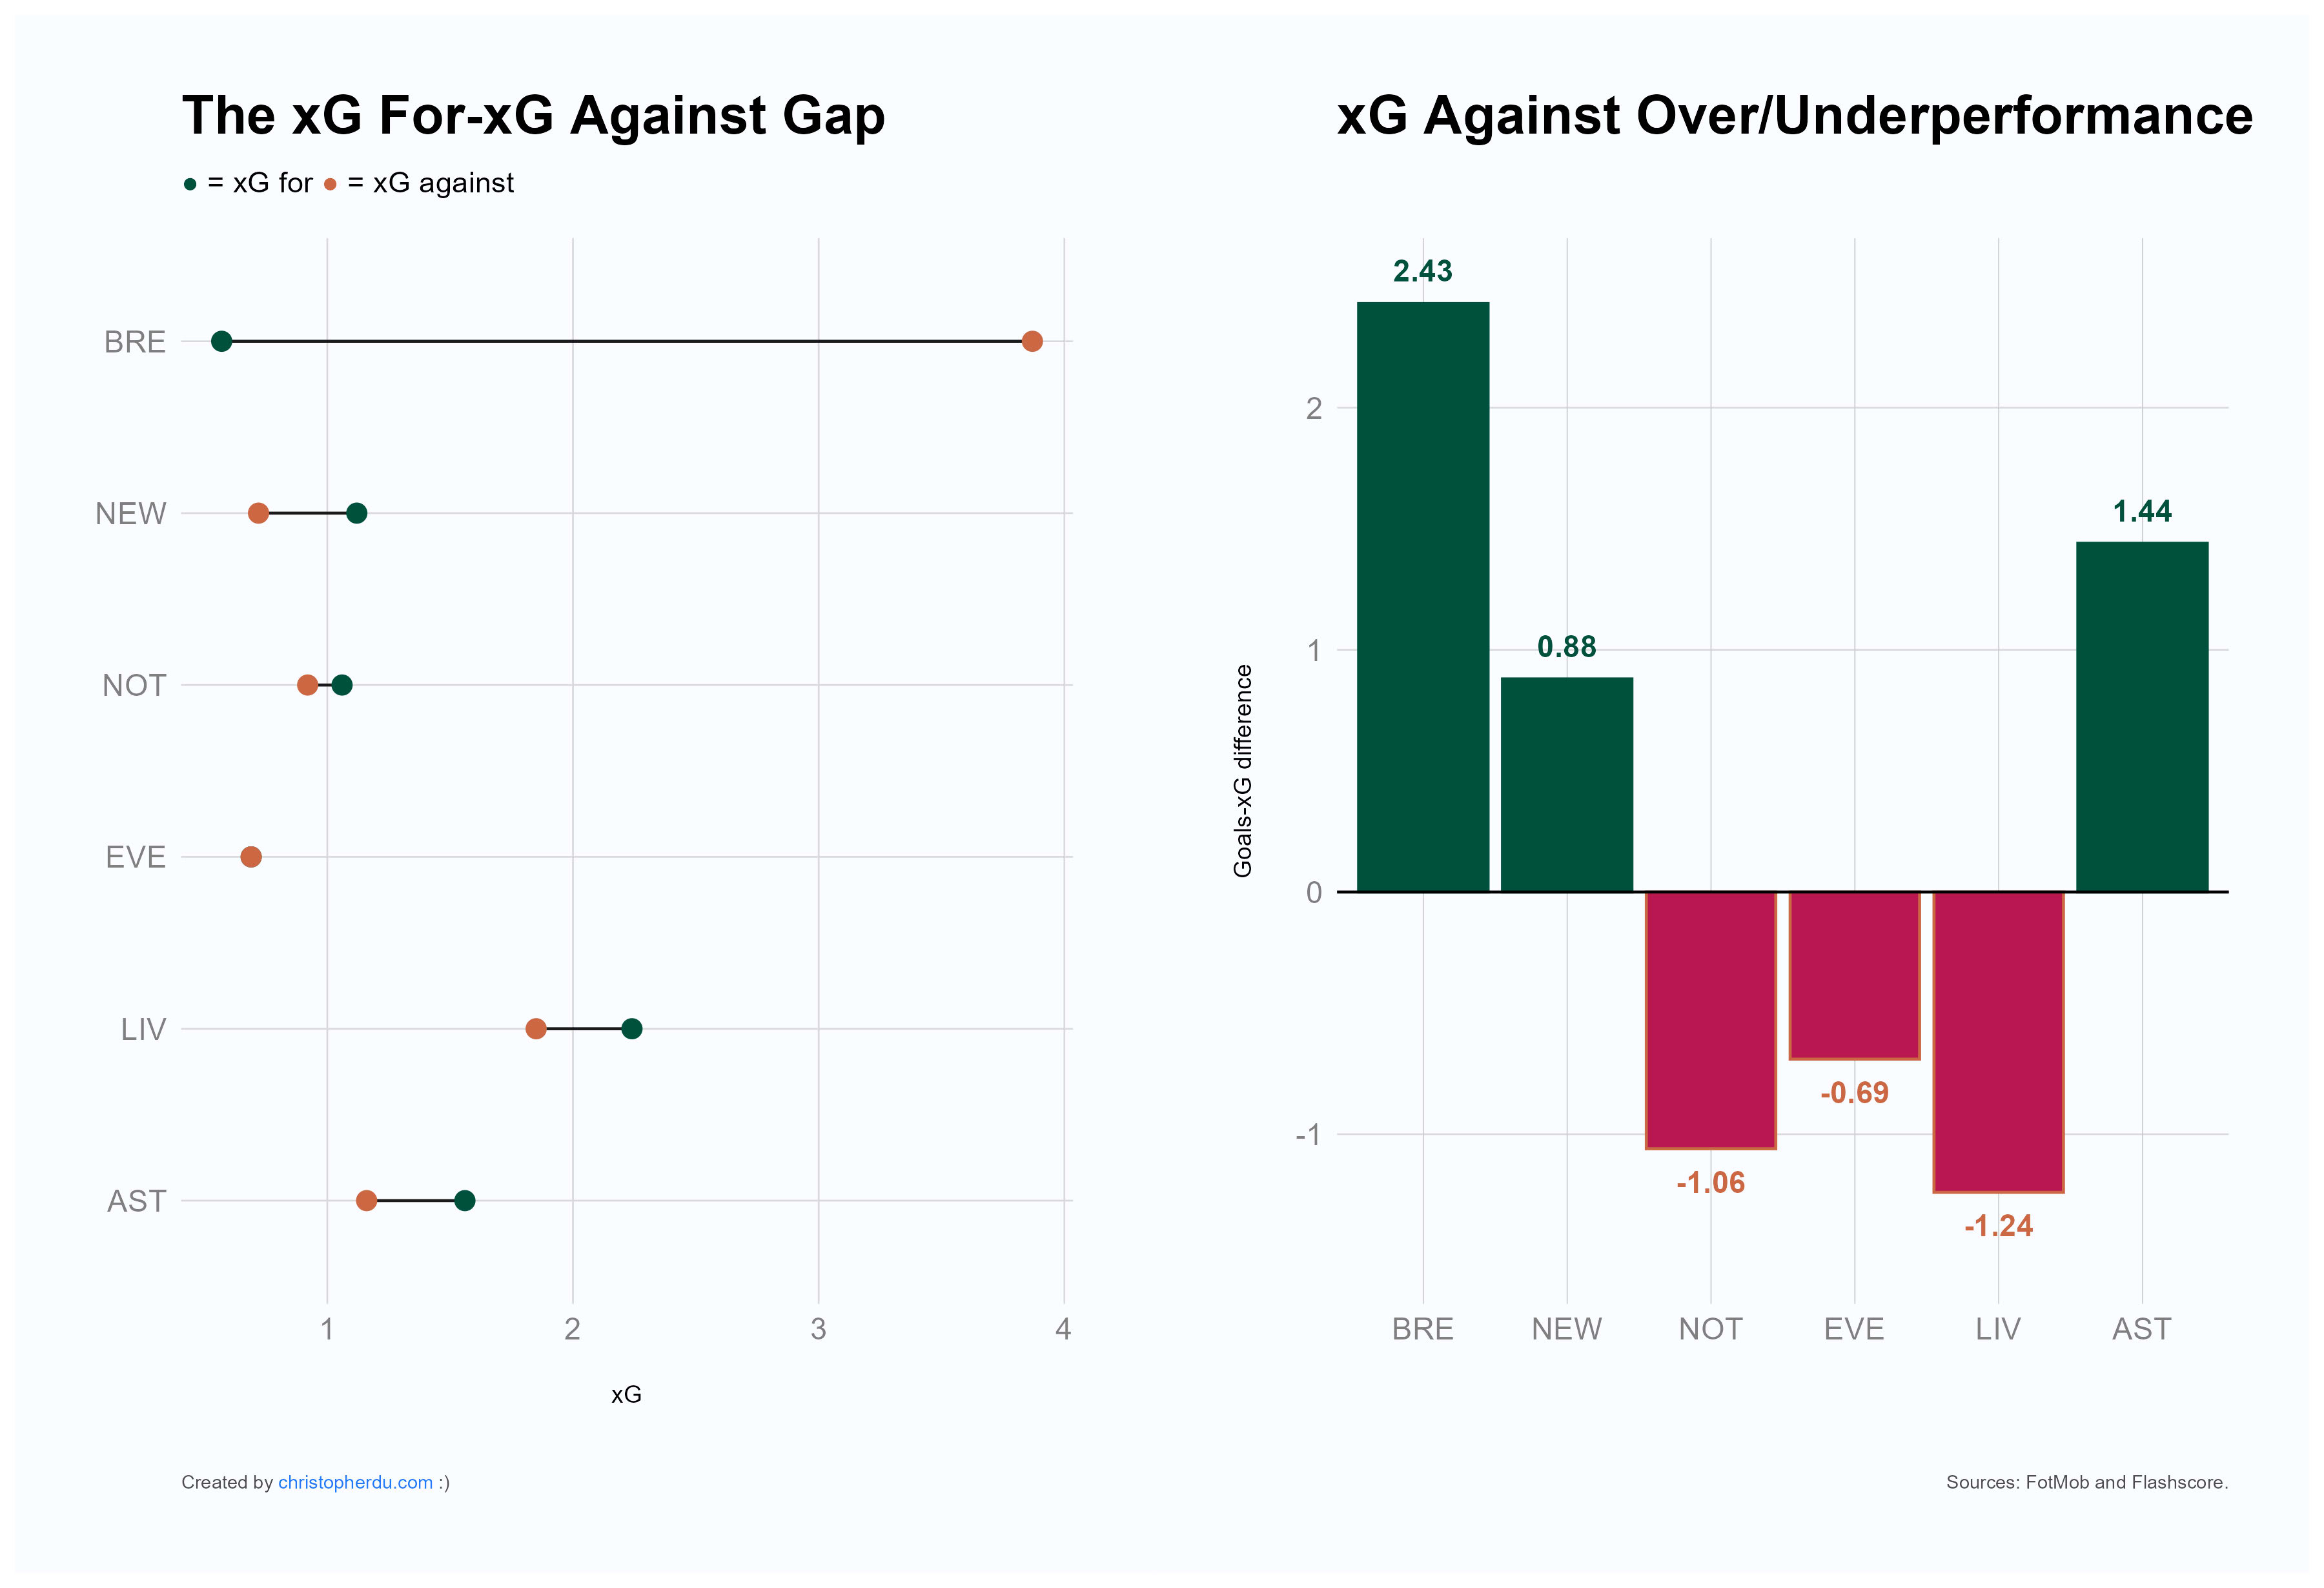
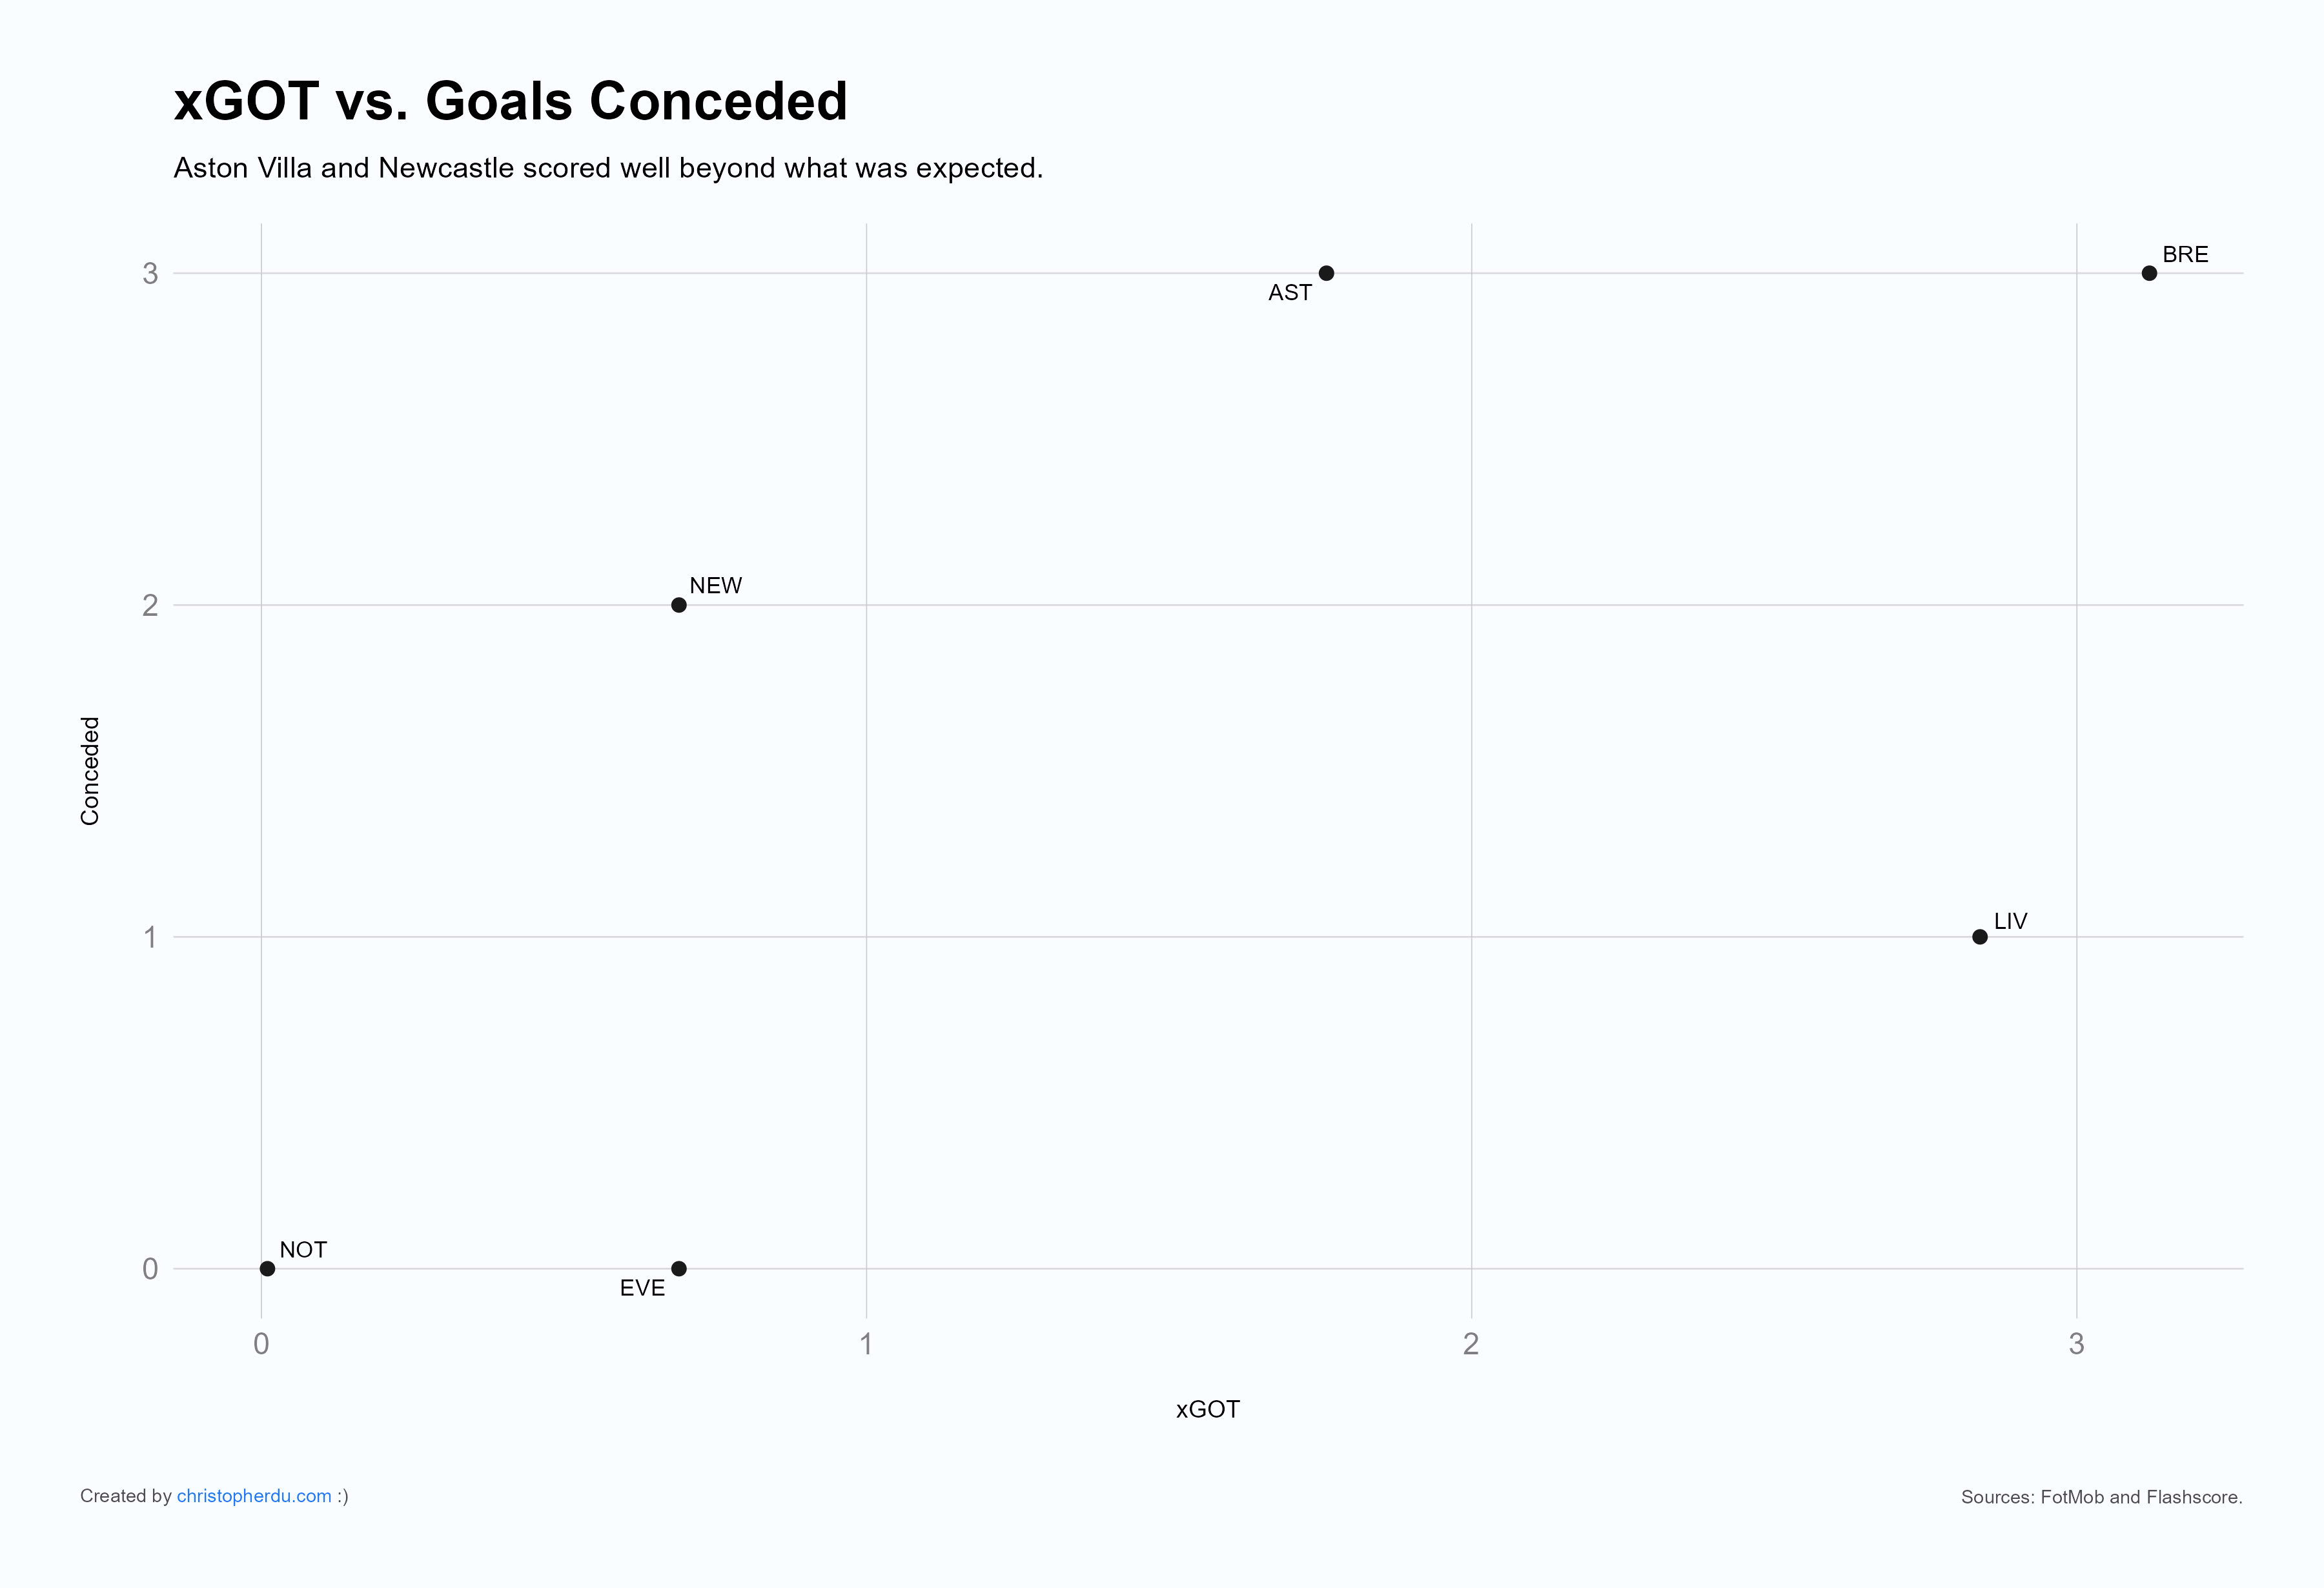
But if we accept this overall attack-minded tactical structure, we actually can see what appears to be positive trends relating to this defence-offence trade-off. There appears to be a correlation between xG for and xG against, but the gap between the two is worth noting. Despite trading off defensive structure, the xG created appears to outpace the xG against generated by a considerable margin (taking Brentford as an extreme outlier, or that the team put in a genuinely terrible performance). When it comes to the number of goals conceded relative to xG against the team, teams that have scored generally outperformed their xG, by an average of around 1.17 points (i.e., one goal). Taking these two patterns together, I believe the idea that the defence is getting worse is weakened ever so slightly. One interpretation I would like to believe in is that a slow start to the season, a product of several variables, paired with poor finishing and final-third decision-making by the team’s forwards, has exacerbated the possible risk-reward imbalance we have seen here.
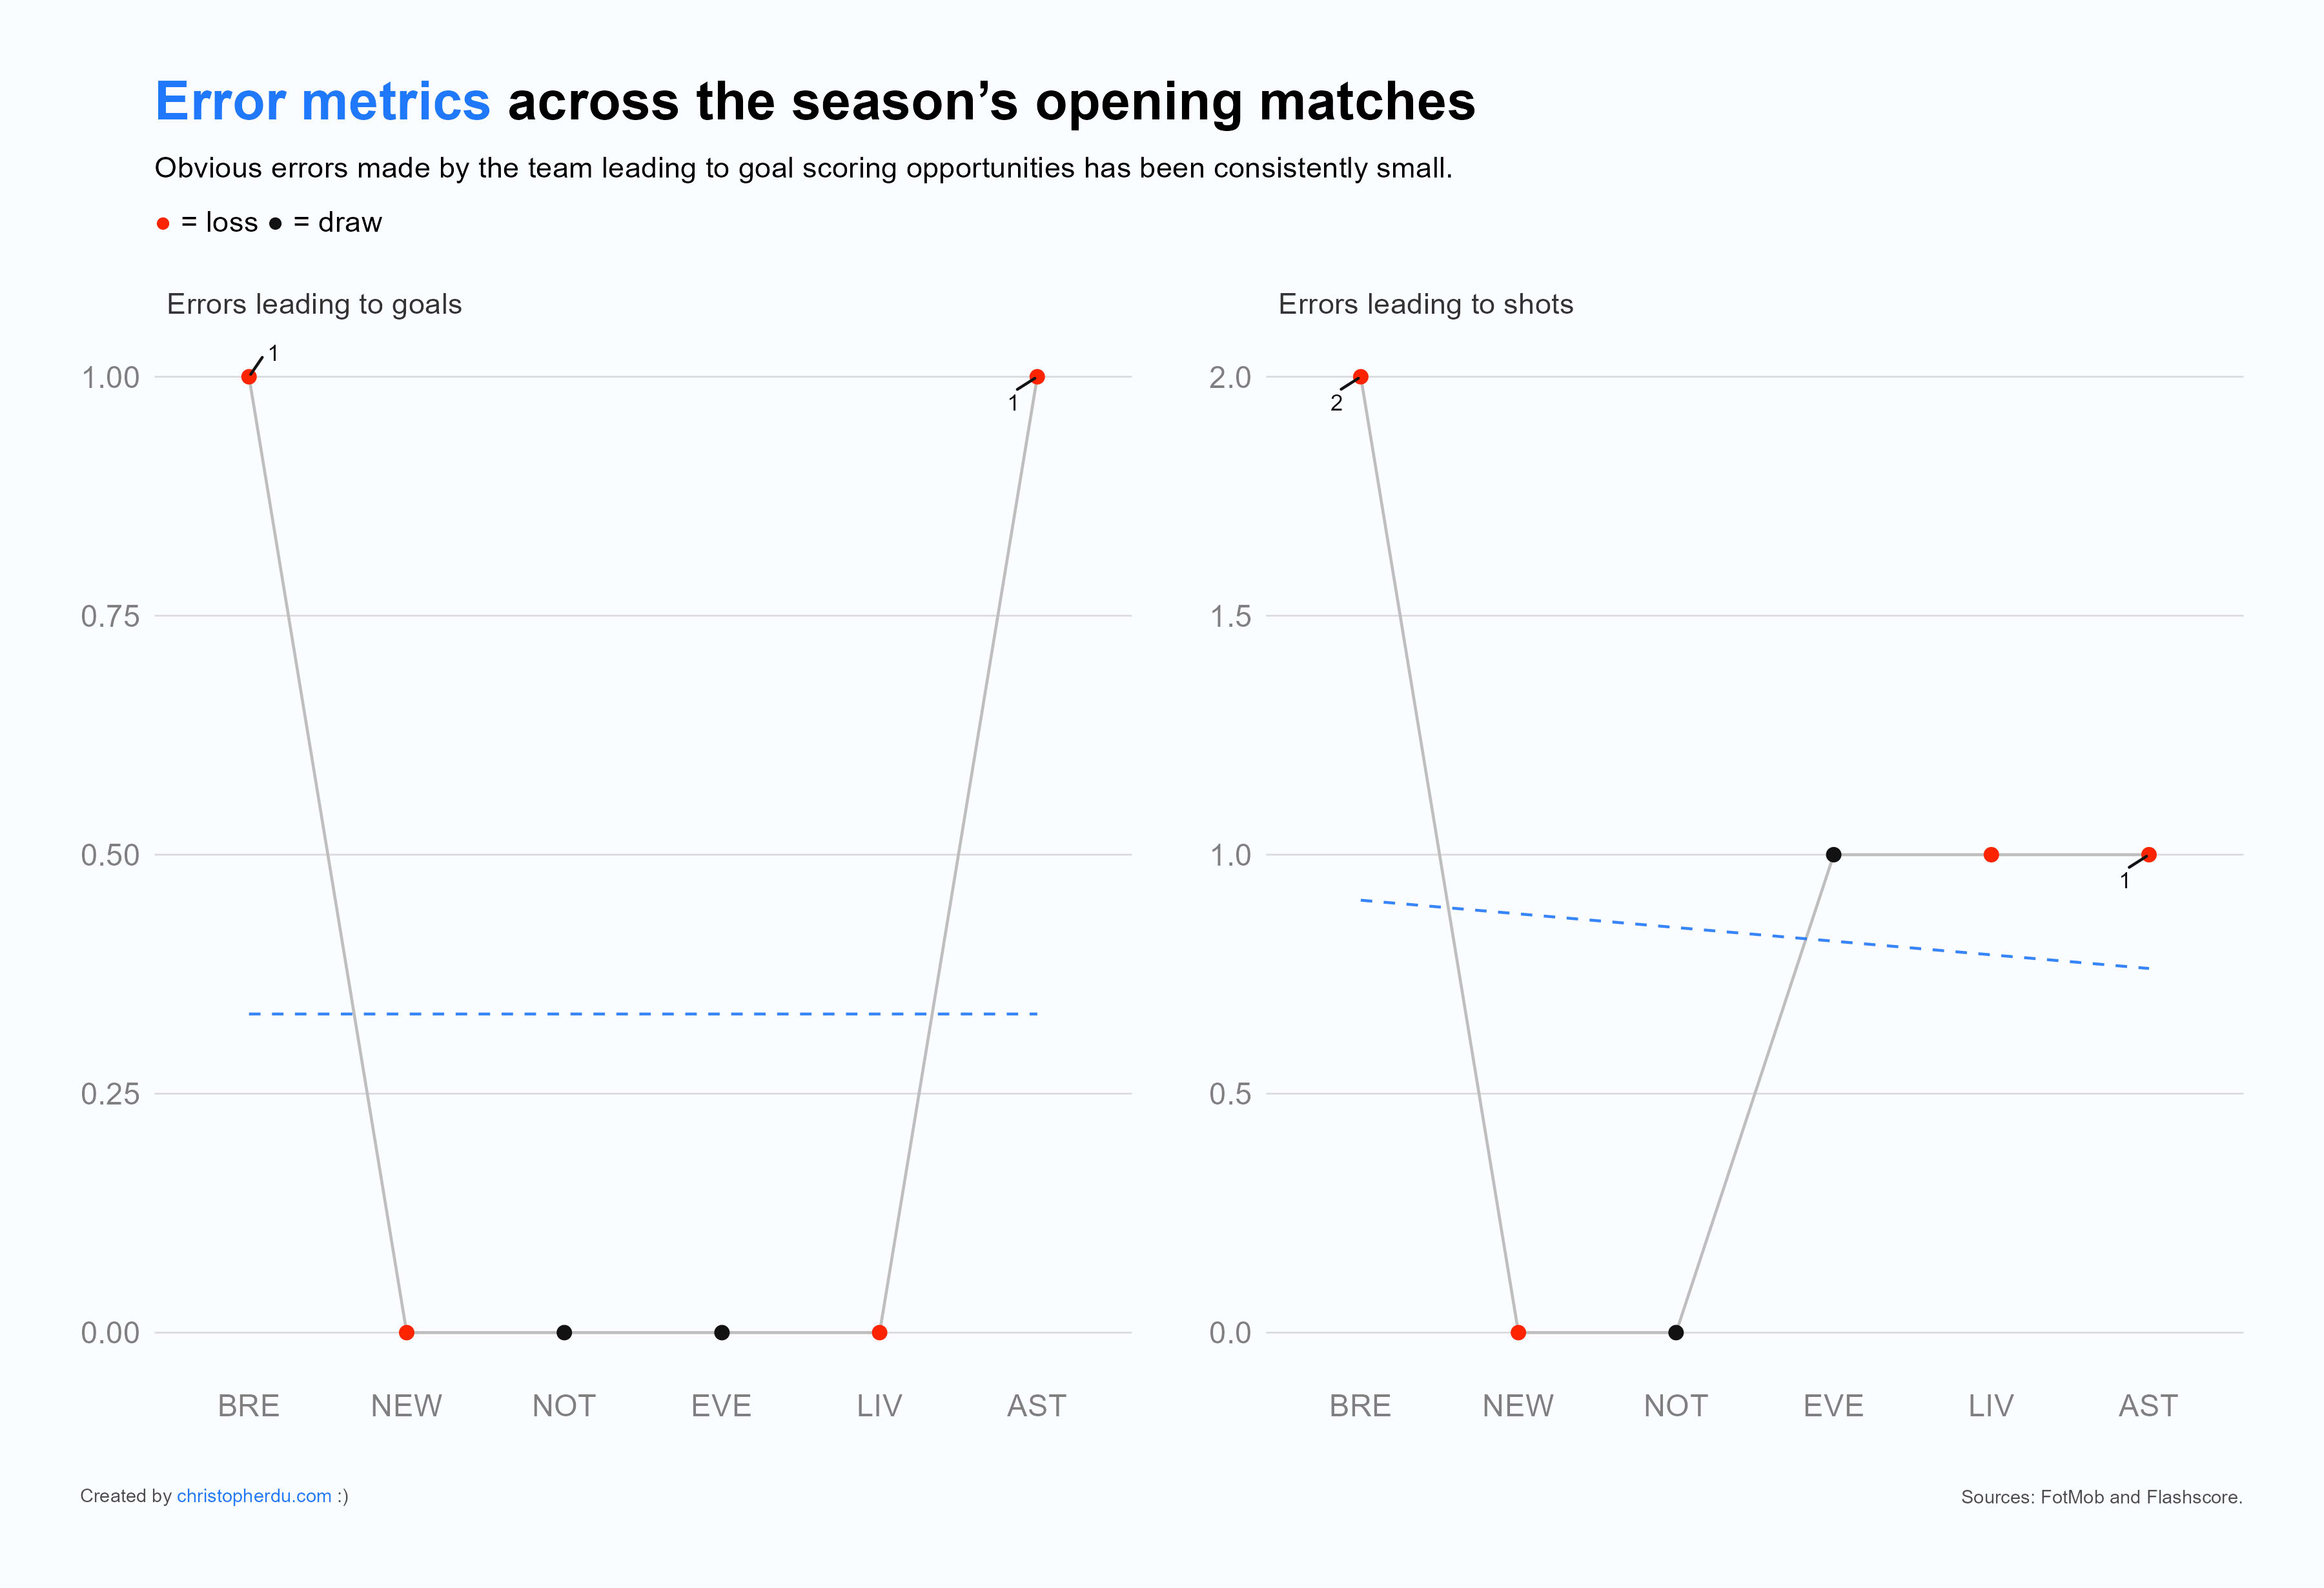
Another variable to factor in is errors made leading to a shot or goal. In the above plot we can see that in both the Brentford and Aston Villa matches that one error was made that led to goal. While I’m not totally confident of the exact formula for xG, it might be the case that “simple” errors have widened the gulf between goals conceded and xG in these cases. What we can attribute to the unspectacular results so far is hard to say with the data above, but it likely includes a combination of luck, goalkeeper underperformance, missed tackles in crucial moments, trading-off defensive solidity for a stronger attack, and errors made leading to shot or goal. In summary, the results we have seen thus far may not necessarily be tightly coupled to a failed or failing defence, but much more context is needed to say one way or the other.
Chances Aplenty
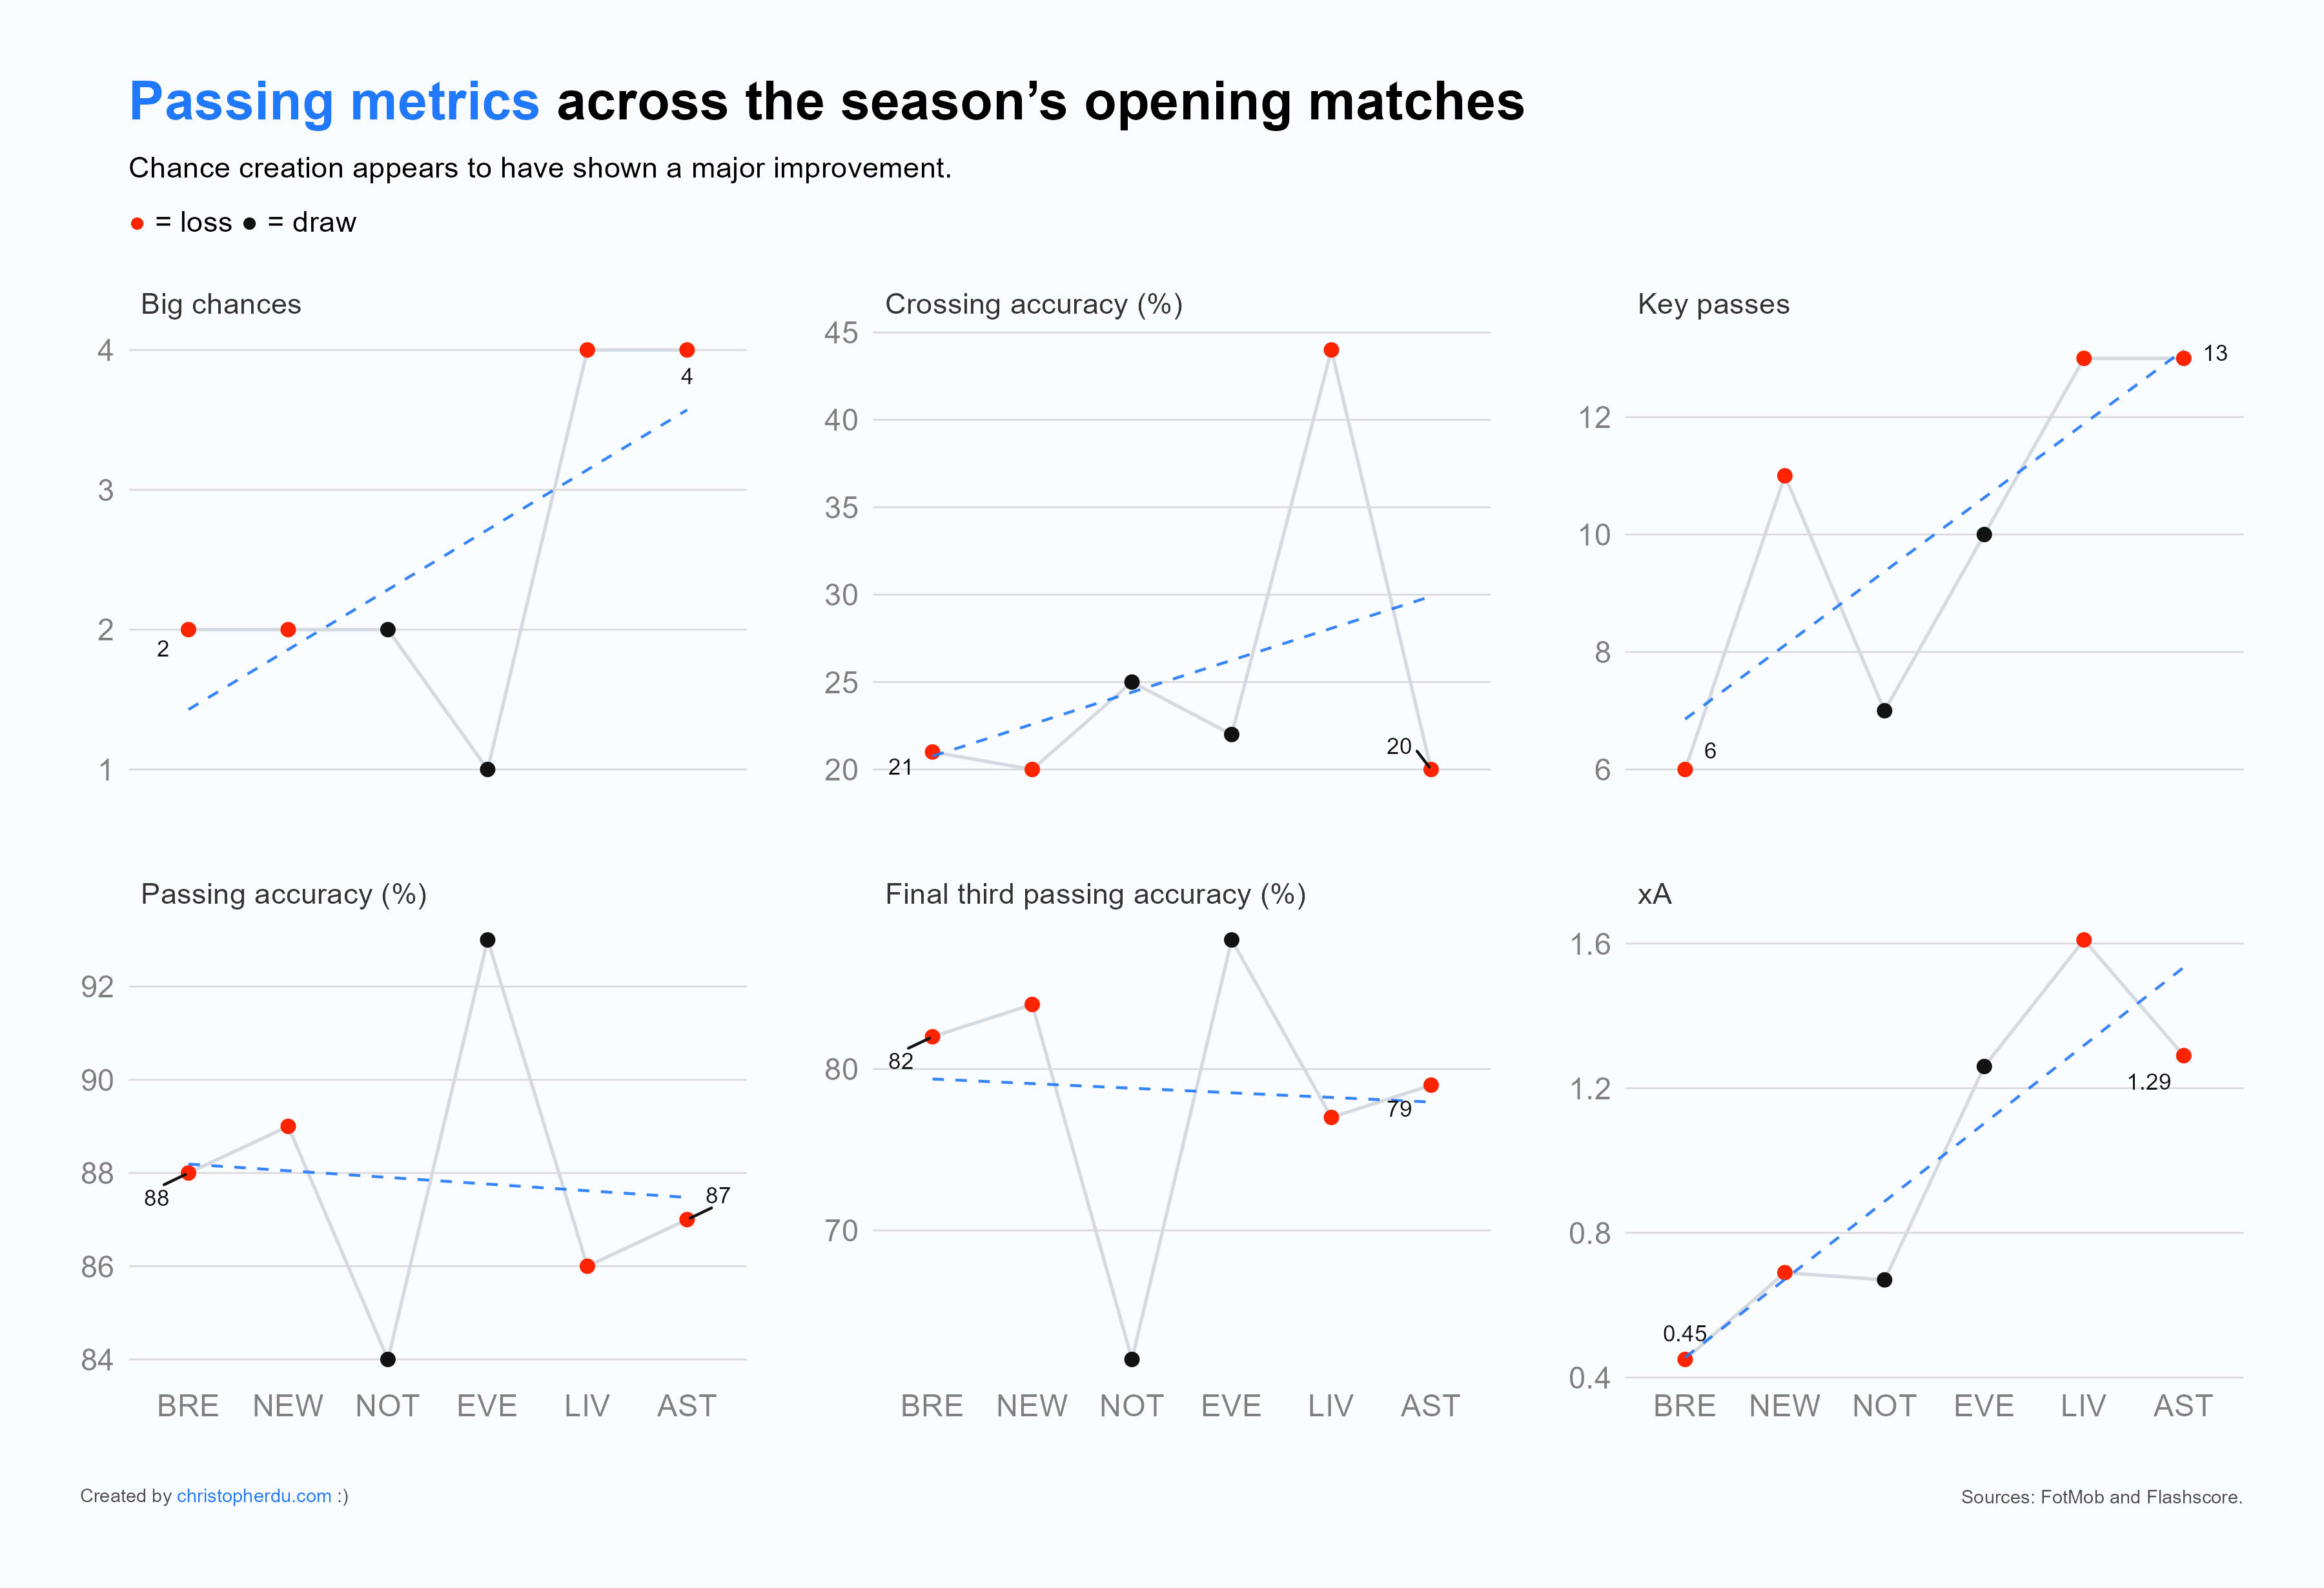
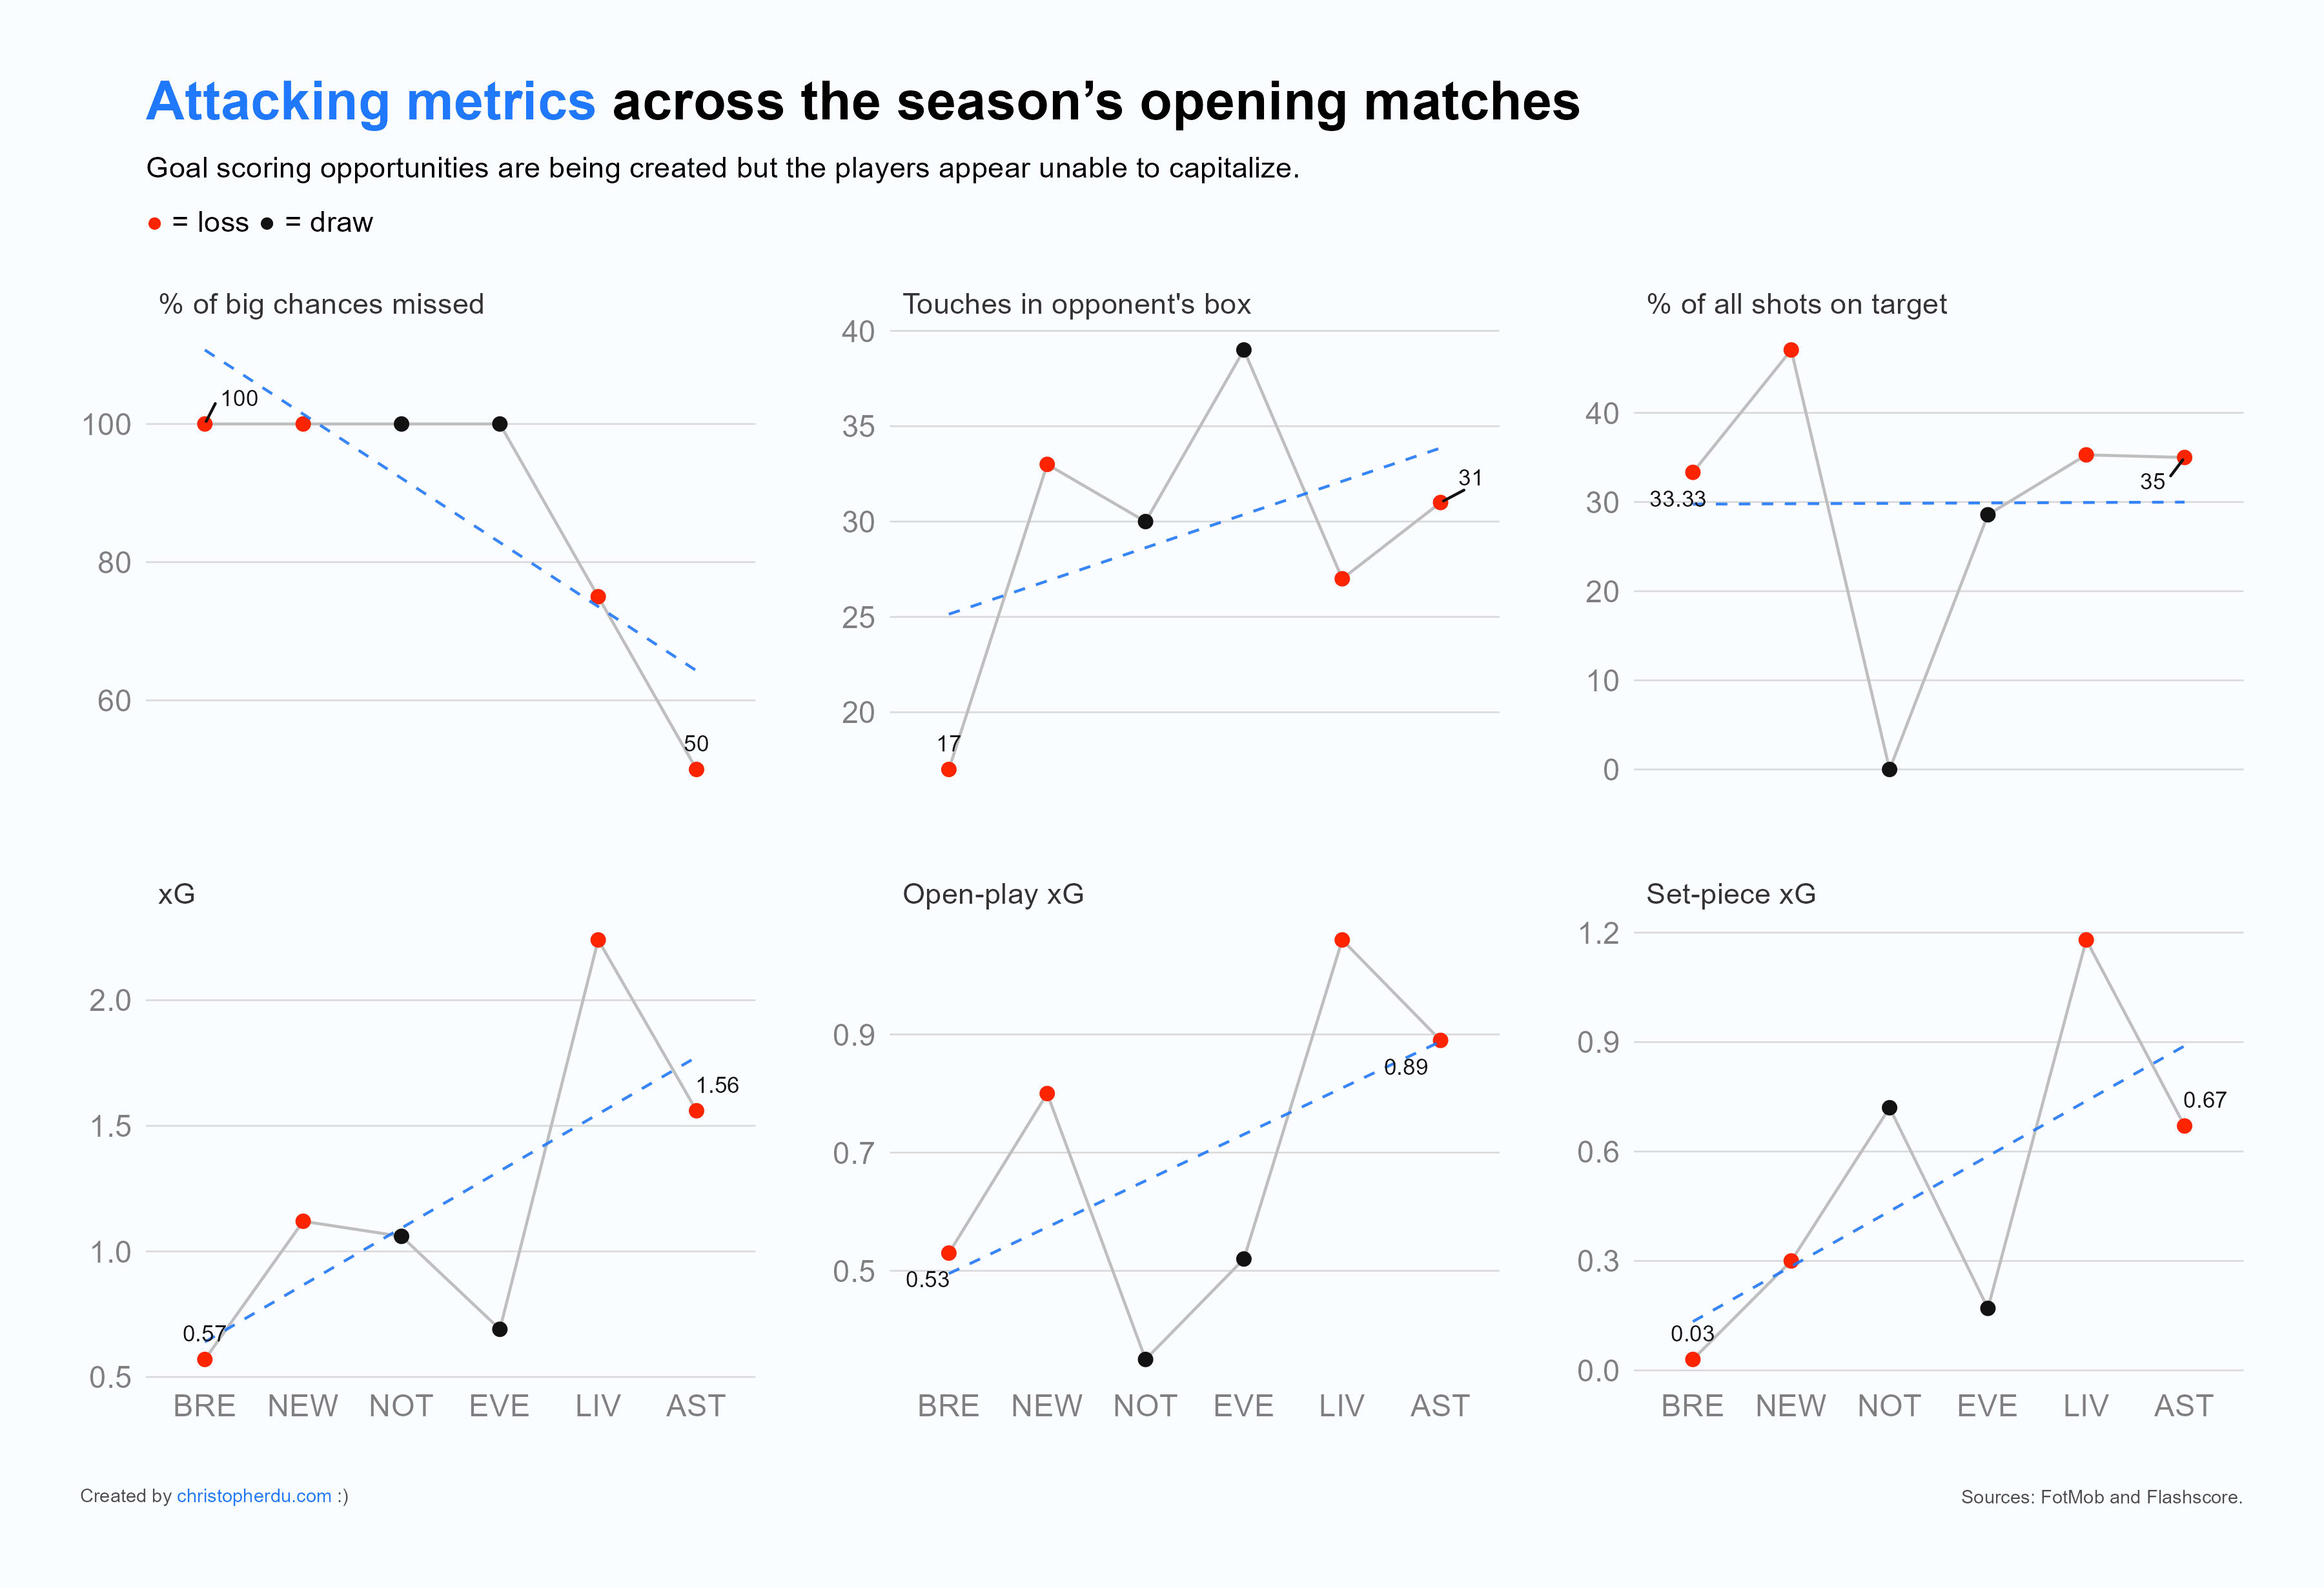
An interesting trend to point out is the general passing performance of the team. Moreover, while chance creation appears to have improved, the general passing of the team, both overall and within the final third, has essentially stagnated. But this is to be expected. Aside from a handful of cases across the entire season, passing accuracy should not be highly variable due to the volume of passes made in a given match. Long balls, through balls, and risky passes are only a small subset of the total number of passes made across an individual match. Thus, it is unlikely that this trend, or lack thereof, is necessarily a bad thing. In short, the key takeaway from these metrics appears to be that goal-scoring chances are being created, and at an increasing rate. An important follow-up that would be useful to look into is where these chances are coming from and who.
Wasteful Tottenham?
Piling the Lilywhite Feathers Together
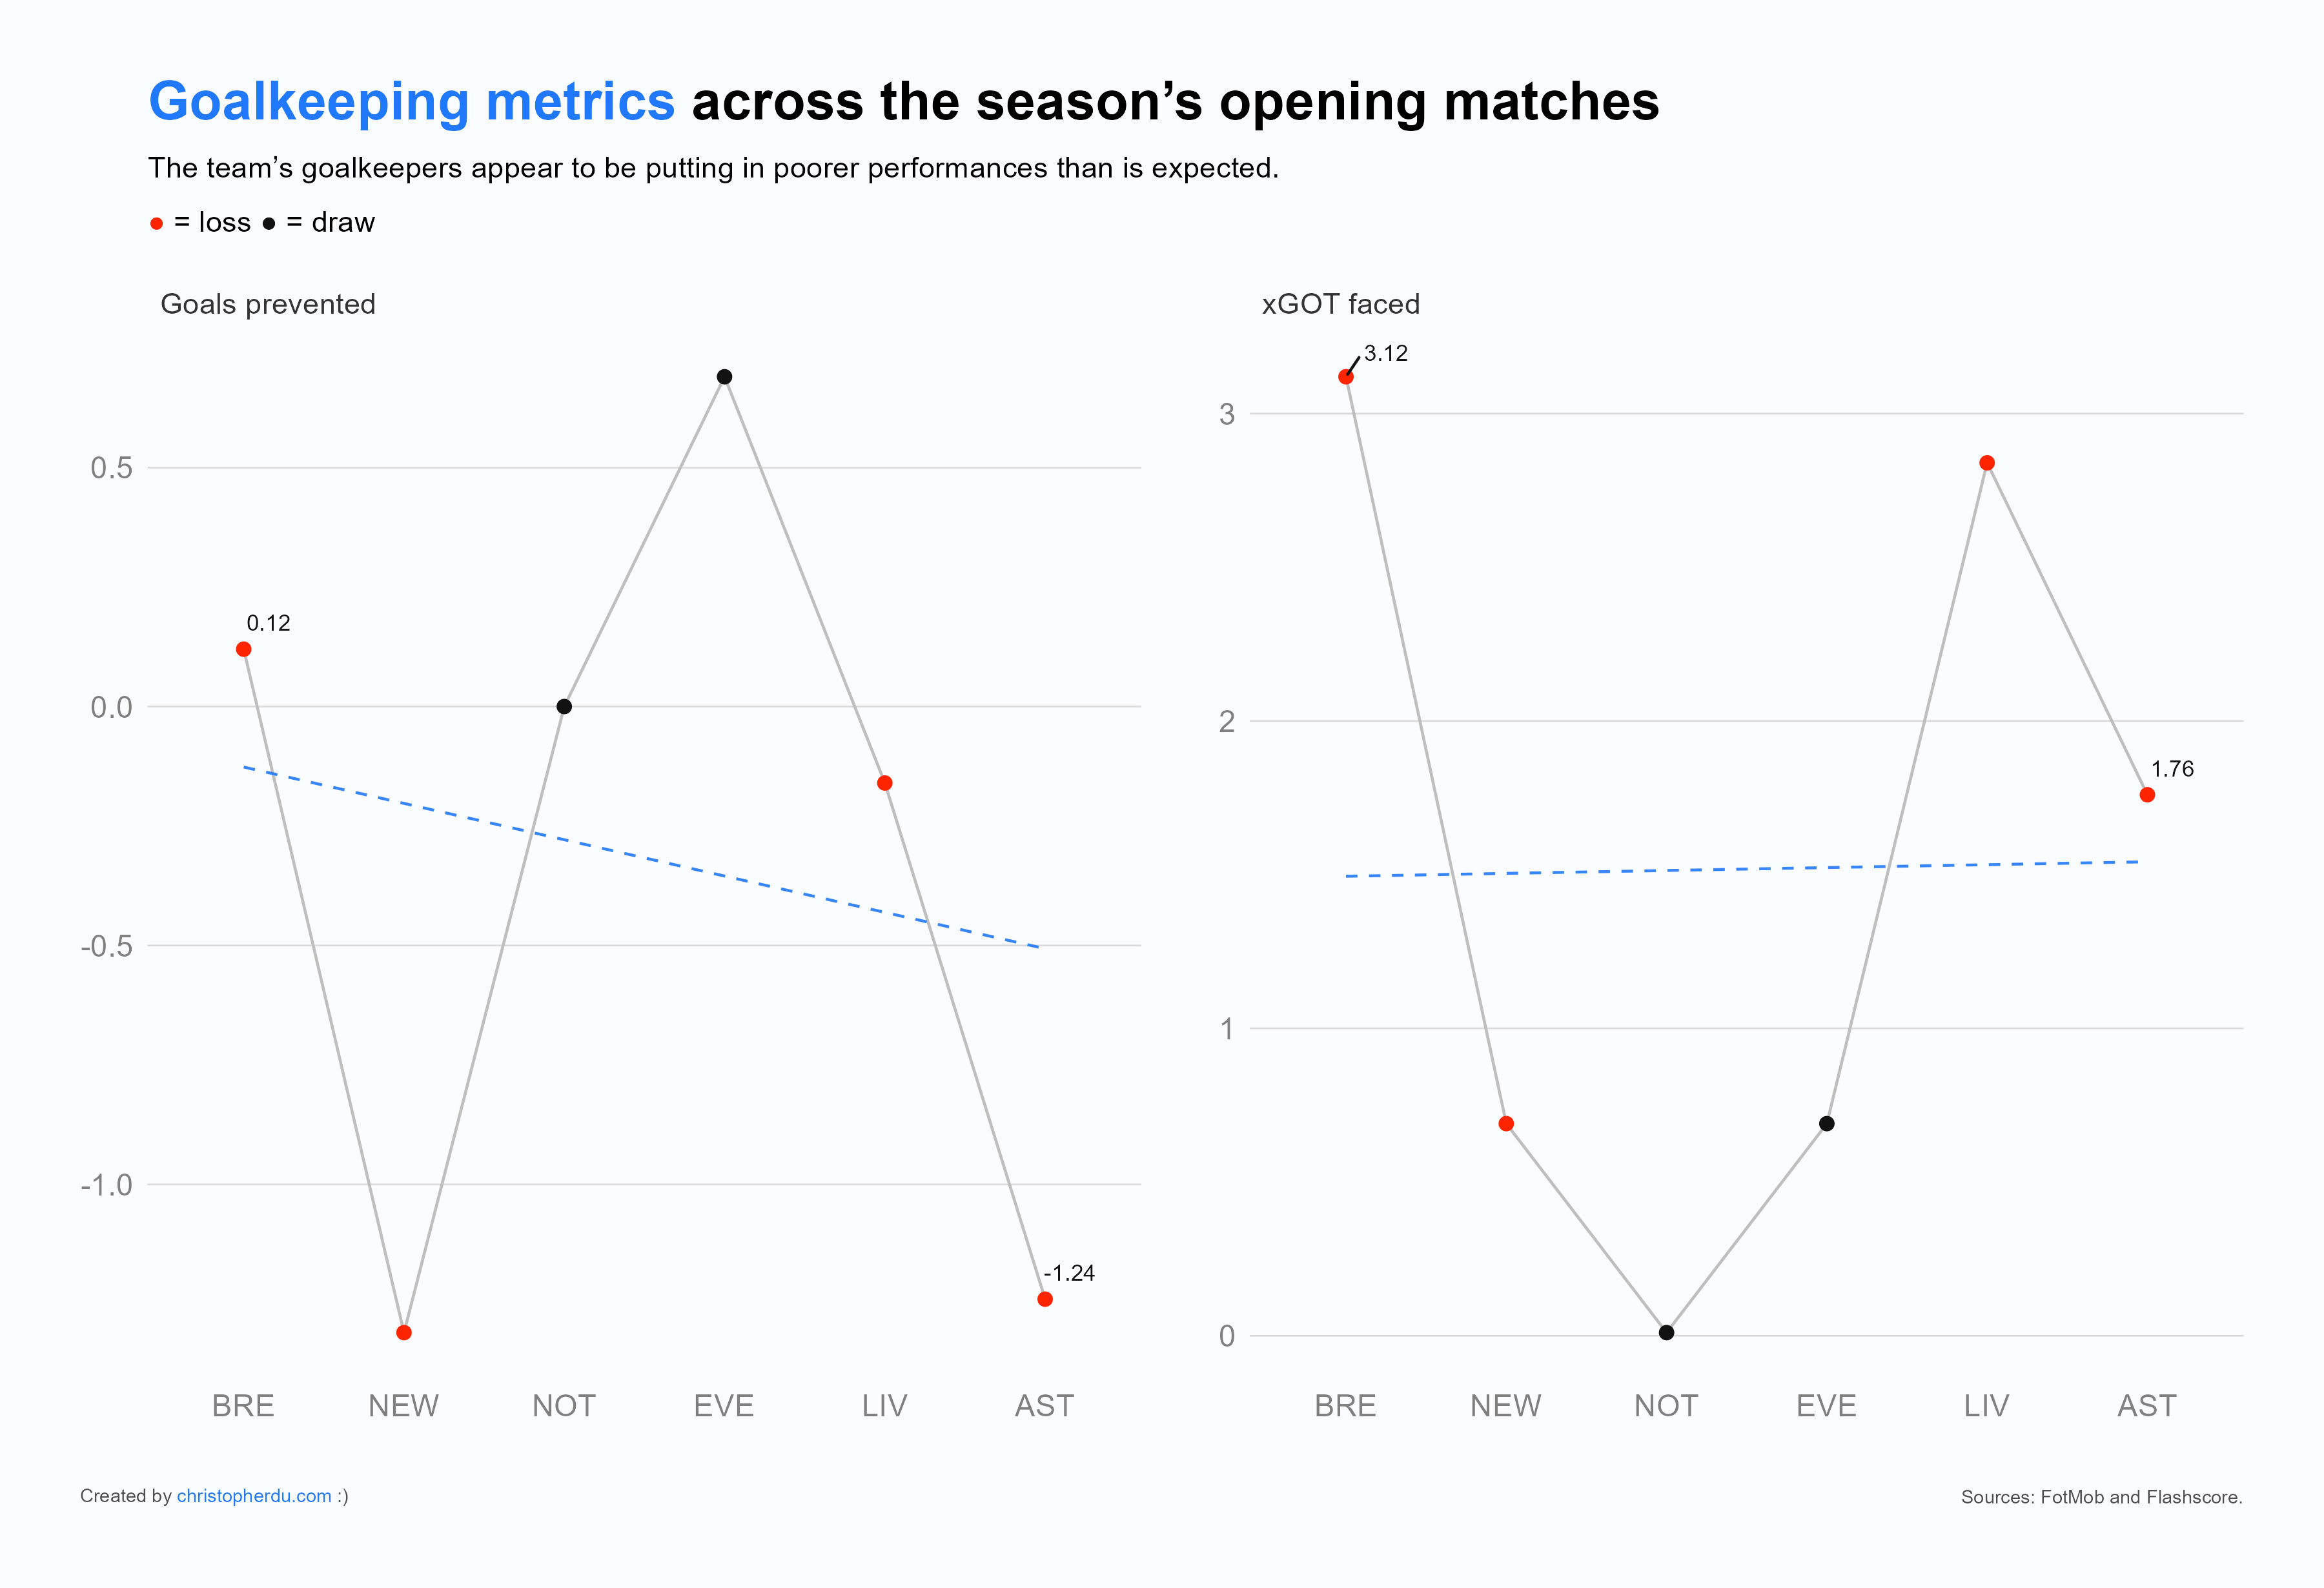
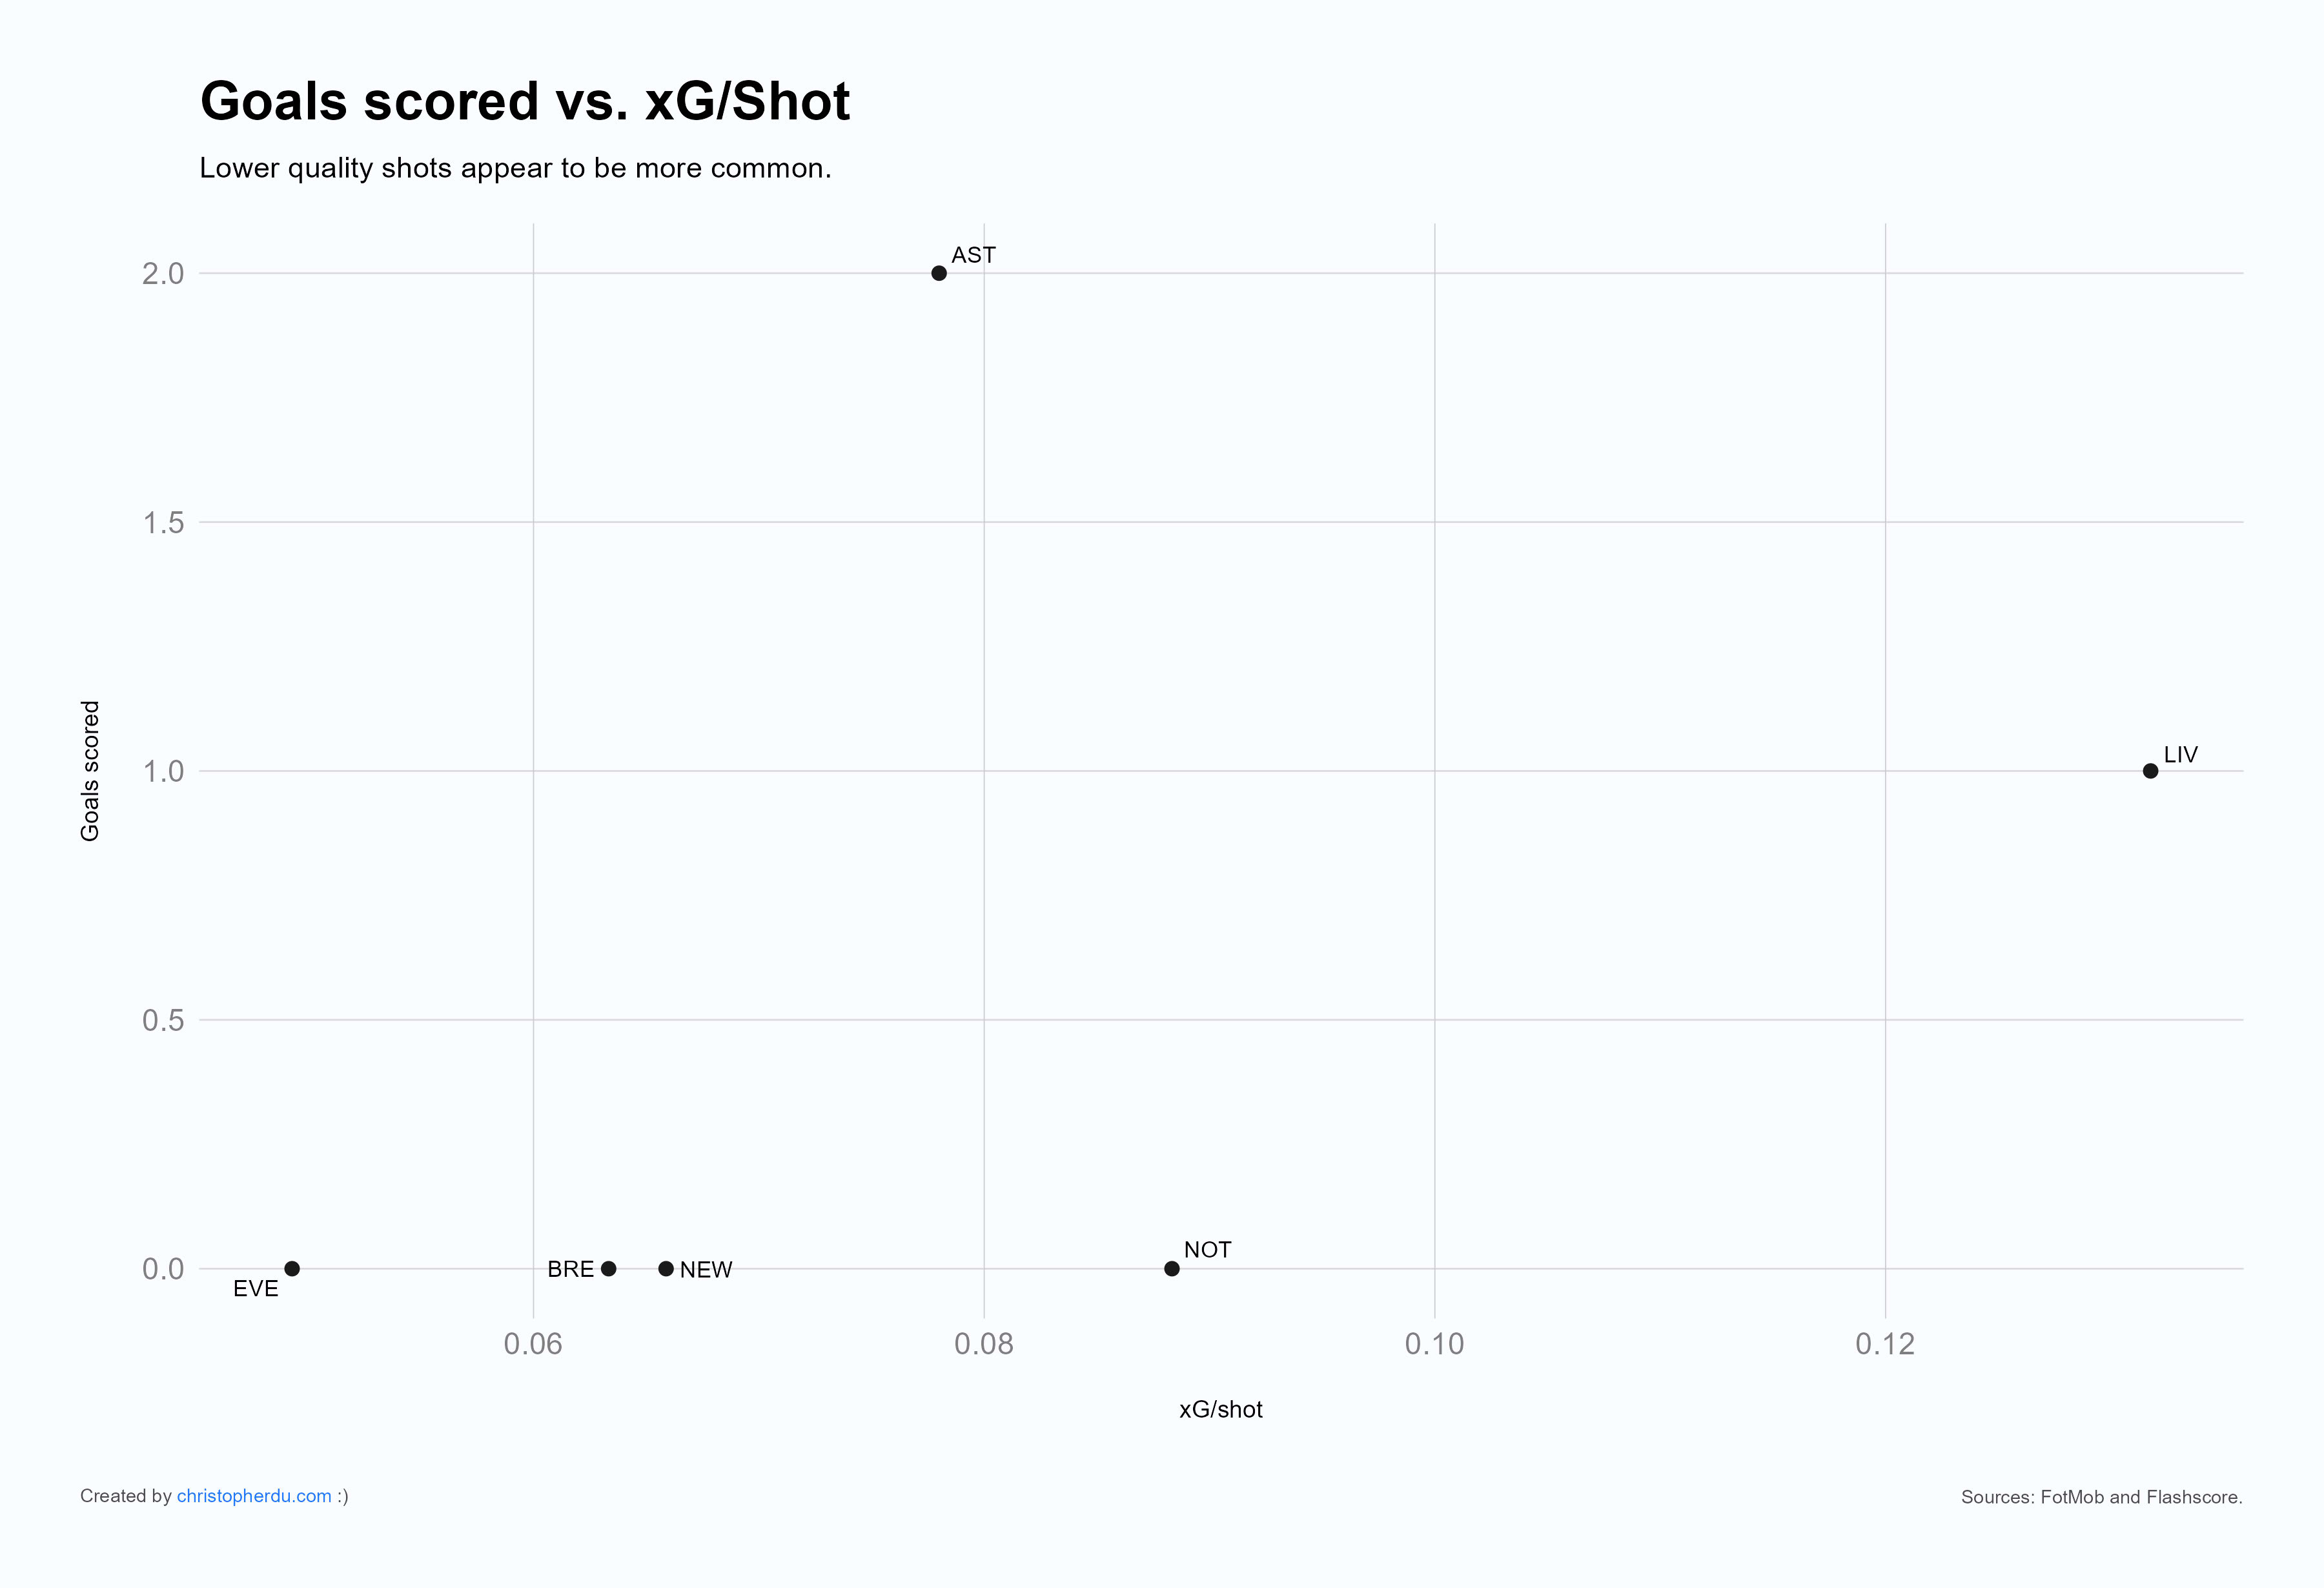
Now having gone through these sets of statistical metrics, the takeaways can be summarized as follows. First, goalkeeping appears to be a cause for concern, with shot-stopping being a particular area that is likely in regression. Second, Tottenham started the season with a lower defensive baseline, in terms of performance, but has shown improvement trends in several areas. While the baseline may be below what is expected and needed, there at least appears to be a growing solidity, two losses in a row aside, that will hopefully continue improving. Third, passing overall has shown a bit of stagnation but the hopeful upside is that there appears to be an important improvement in chance creation. At some point, chances will have to be scored and if this improvement continues, it may be only a matter of time before goal scoring becomes a more common event. Lastly, it appears that Tottenham’s forwards are being wasteful, missing goal-scoring opportunities that really should be goal conversions. This casts a thunderstorm over the optimism of the previous trend and is an area of urgent attention.
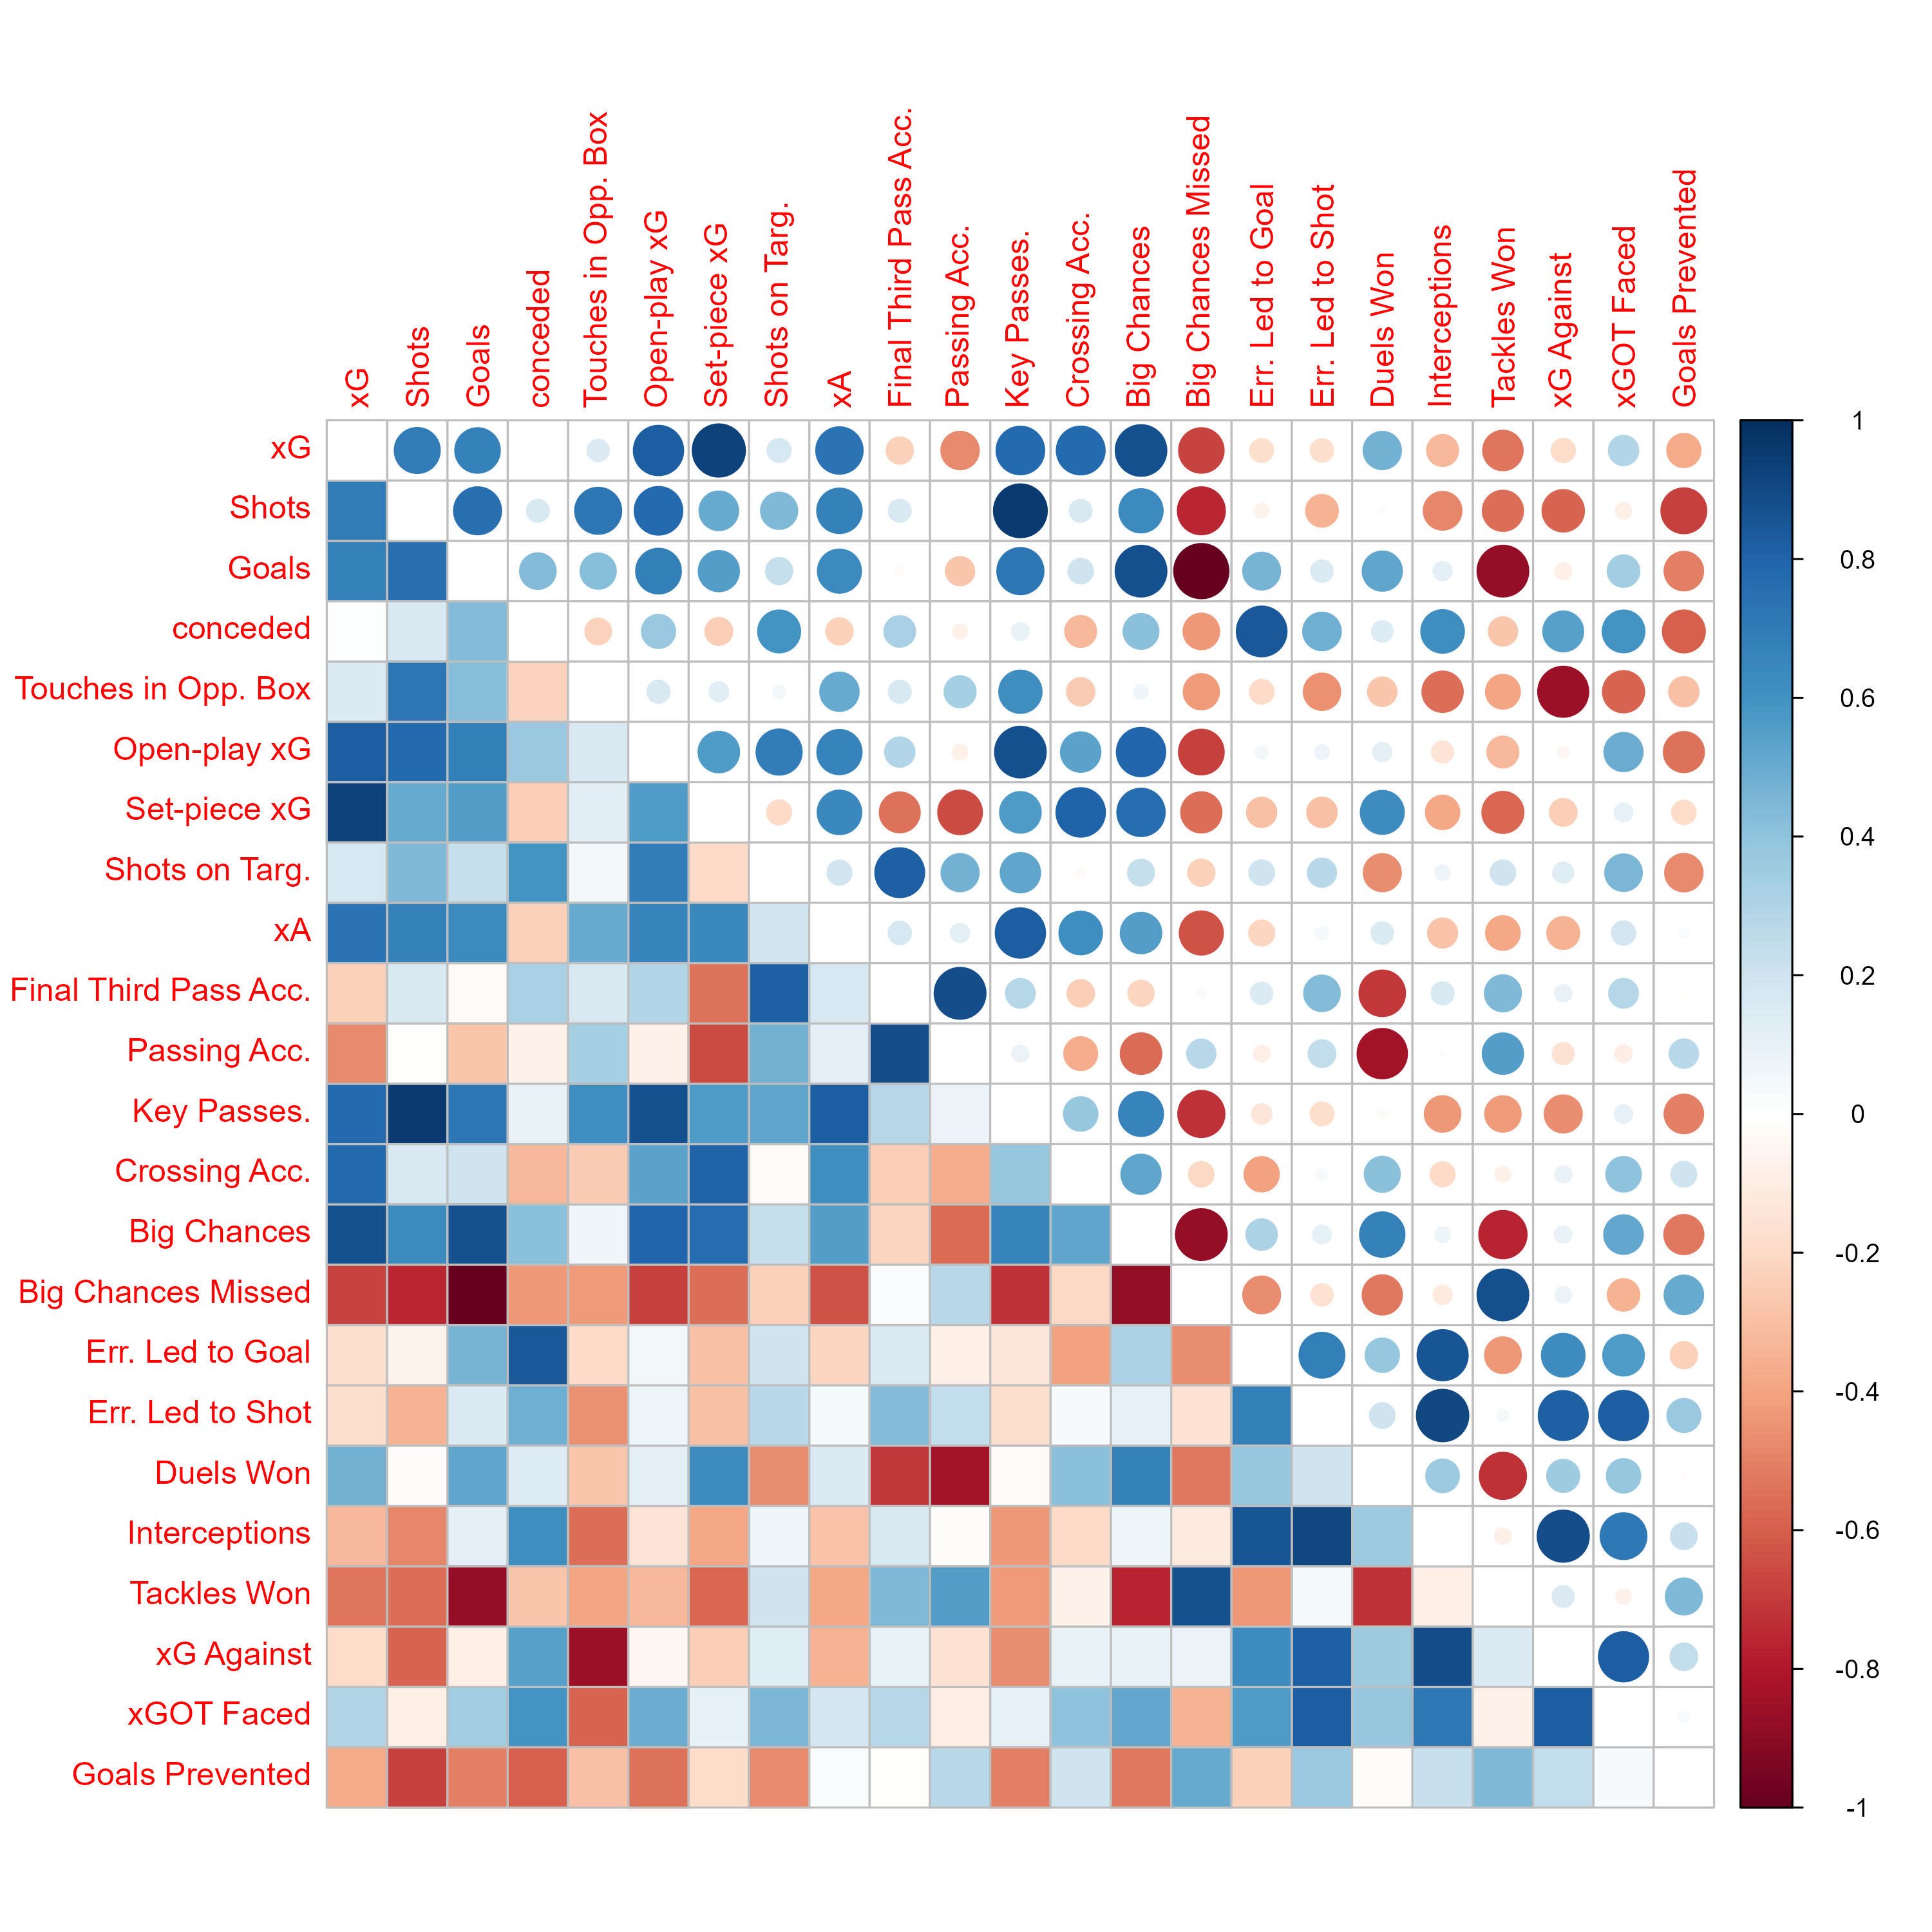
As a result, I believe these metrics demonstrate that there is still optimism to be had. The Summer transfer window re-ignited a dying light in every Tottenham supporter, but there was also a subtle recognition that goal scoring was going to be the team’s weakest area. Selling Brennan Johnson, the outcasting of Richarlison, and the signing of two attackers specializing in penetration but not scoring, Savio and Marmoush, has essentially left the team with no natural goalscorers—all hope appears to lie on Solanke’s shoulders. We can only hope that goal scoring can grow henceforth as chemistry builds, De Zerbi’s tactical setup settles in the squad, and injured players return to the pitch. With this hope in mind and the positive statistical trends in defence and passing, there may yet still be room left for an optimistic Tottenham Hotspur fan. With that, I leave you with one last plot, a messy one but will hopefully be of some interest to someone to gain a better look at the relationships between these statistical metrics.