The Effects of Highlighting on Cluttered Visual Search in Virtual Reality
Research question(s): How does visual clutter affect visual text search in VR and can highlighting techniques help?
We designed a study to investigate how visual clutter affects visual search for a target in a reading context within virtual reality (VR). We also compared the effectiveness of three text-highlighting techniques for aiding cluttered visual text search. Our results showed that text highlighting can confer benefits, but their benefits are context-dependent.
- Duration
- 2 months
- Team
- 2 researchers
- Method
- Within-subjects experiment
- Tools
- Apparatus
My role included co-designing the interview questions, carrying out the interview with participants, cleaning the transcribed audio of the interviews, leading the inductive thematic analysis, and analyzing workload differences in R. See details
The Problem
Virtual reality (VR) offers new and interactive experiences where the user is immersed within a virtual environment. These virtual experiences and environments are often very dynamic and introduce a deluge of visual information.
Guiding users through these experiences can occur in several ways but the most intuitive is through reading. VR experiences are a novel, but familiar, environment where the dynamics of the environment and visual clutter can degrade the performance of attention-based tasks, such as reading. Thus, we investigated how visual clutter affects users in a VR visual text search task and how visual search could be improved through text highlighting.
Method
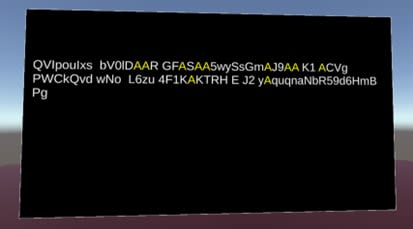
Three text highlighting techniques investigated in this study. We also included a baseline in which there was no highlighting technique used.
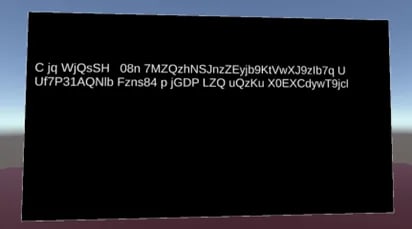
No sort of highlighting used as a baseline condition.
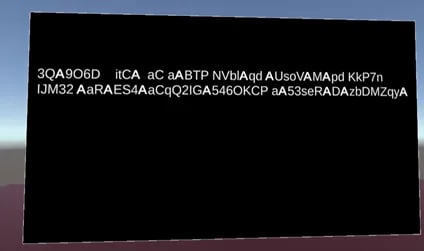
The target letter is simply bolded.
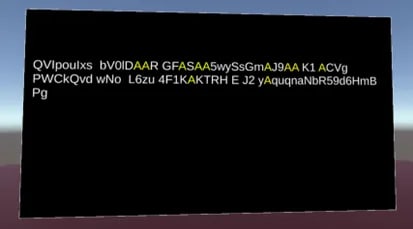
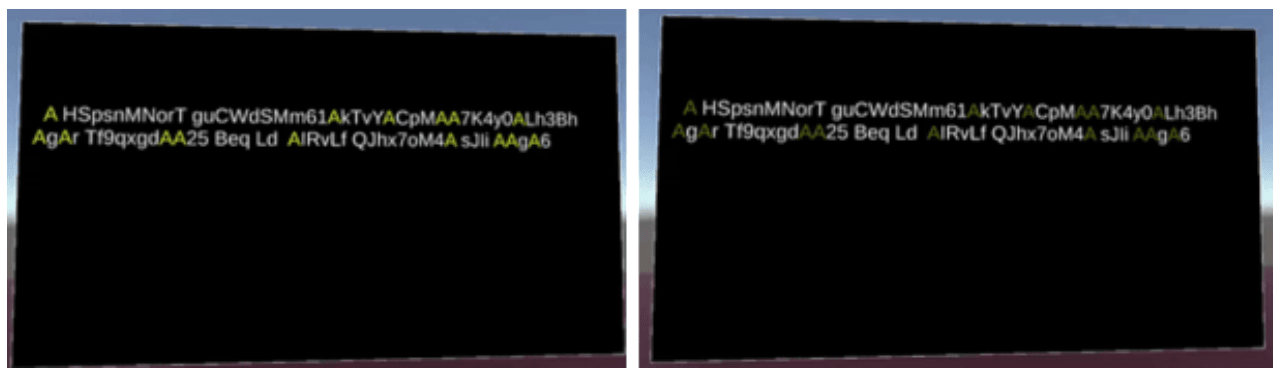
The target letter is coloured a solid yellow.
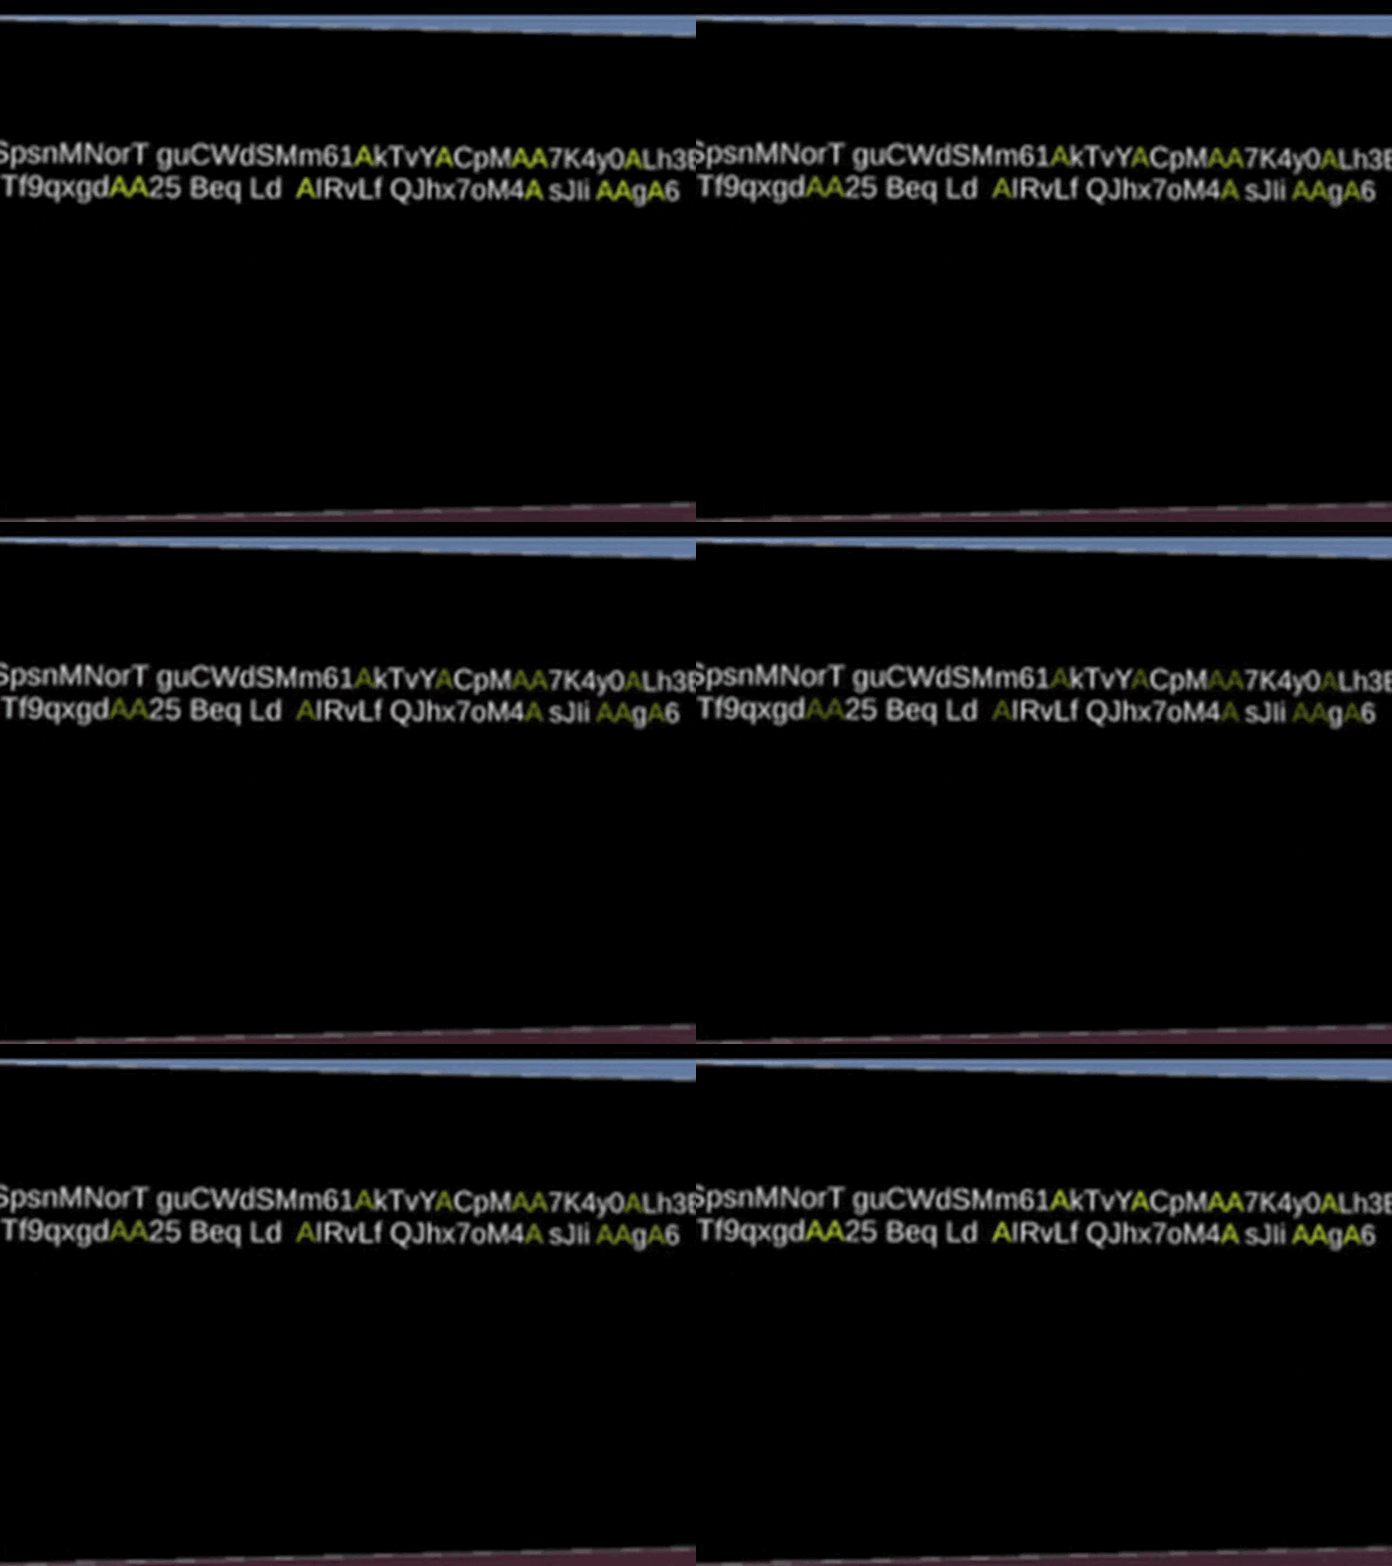
The target letter is coloured yellow with a short fluctuation of colour.
Also looked at two levels of text visual clutter (the number of characters in the pseudocode) and two levels of target frequency (proportion of characters the target letter A composed of the pseudocode).
Pseudocode is 100 characters long and the target character makes up 13% - 17% of total characters.
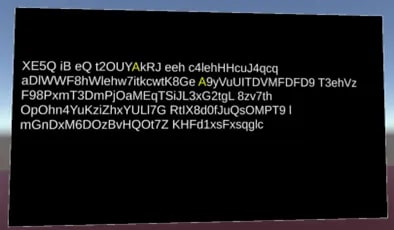
The pseudocode was 200 characters long and the target character makes up 1% - 5% of total characters.
Participants
Given the constraints of the project, we recognized that convenience sampling would be the most feasible approach.
8 participants recruited using convenience sampling. Mean age of 28.13 and an average of 1.03 years of prior VR experience.
Task
We wanted to simulate a scenario where a user was searching for important textual information (e.g., instructions). But, the task needed to avoid acting as a potential confounding variable and would be implementable within the constraints of the project.
We presented participants with pseudocode (i.e., a random sequence of alphanumeric characters) in the VR environment and asked them to count the number of target letters (the letter A) present.
Experiment Design
We anticipated a small sample size. Hence, we planned an experiment design that maximized our statistical power.
A 4x2x2 within-subjects experiment where all participants experienced all four highlighting techniques as well as the two levels of visual clutter and target frequency. Each condition combination (16) consisted of one trial of the task.
Measures
We needed to determine to what extent these highlighting techniques made visual search more efficient and effective, and also understand how the interaction between highlighting and visual clutter affected users.
Quantitative: Task completion time (TCT) and target count accuracy.
Subjective: NASA-TLX scores to measure cognitive workload.
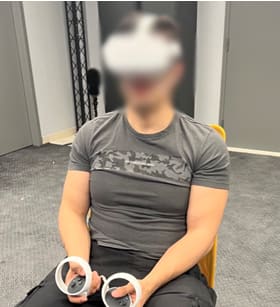
Qualitative: Post-experiment semi-structured interview transcribed using a Zoom recording.
Sample Interview Questions
We developed 9 categories of questions, each with three individual questions.
Perception of Highlighting Techniques
- What did you notice about the different highlighting methods?
- Which technique(s) helped you identify the “A”s most effectively, and why?
- Were any techniques distracting or hard to interpret? What made them challenging?
Impact on Search Strategy
- Did you change your search strategy when the highlight changed?
- How did the highlighting methods affect the way you searched for “A”s?
- Which aspects of the cues (brightness, sharpness, etc.) influenced you most?
Effect of Clutter Density
- How did the Low-Clutter (100 characters) and High-Clutter (200 characters) conditions?
- Did one feel more challenging than the other?
- Did clutter level change your counting strategy?
Results
Both visual clutter and target frequency led to slower overall TCT. Colour and Flicker both provided substantial benefits across the board for TCT.
Overall, target count accuracy was severely affected by visual clutter. Colour and Flicker were found to provide equally important improvements.
Colour was found to induce the lowest cognitive workload and Bold induced the most.
We identified three major themes relating to the negative effects of visual clutter, the benefits of a stable and contrastive highlight, and the dichotomous effects of Flicker.
Task completion time
Participants completed the task faster overall using Colour (9.25s) and Flicker (10s) compared to either Bold or None (see Figure A).
One-way repeated-measures ANOVA | F(3, 21) = 28.10, p < .001, η2 = .80.
Low clutter levels (10.32 sec) resulted in substantialyl faster overall TCT compared to higher levels (see Figure C).
One-way repeated-measures ANOVA | F(1, 7) = 79.57, p < .001, η2 = .92.
When target frequency was high, Colour (13.5s) and Flicker (14s) resulted in faster TCT compared to Bold and None (see Figure B).
Two-way repeated-measures ANOVA | F(3, 21) = 9.24, p < .001, η2 = .57.
Figure A
Figure C
Figure B
Target Count Accuracy
Overall, participants had more accurate target counts under low clutter compared to higher levels of clutter (see Figure A).
Friedman test | χ2(3) = 7, p < .01.
Participants also had more accurate target counts when using Colour (100% median) and Flicker (100% median) compared to Bold and None (see Figure B).
Friedman test | χ2(3) = 9.66, p < .05; post-hoc Wilcoxon test showed no significant comparisons.
Figure A
Figure B
NASA-TLX
Overall, it was found that Colour (22.5) induced the least amount of cognitive workload.
Friedman test | χ2(3) = 14.39, p = .02.
Looking at the subscales, Colour was also found to be less mentally demanding.
Friedman test | χ2(3) = 19.25, p < .001.
Lower is better.
Inductive Thematic Analysis Results
A brief summary of the key points of our analysis.
Theme 1: Visual clutter and target frequency have real effects
- Increased target frequency instilled false confidence in participant task performance via greater spatial concentration of target letters.
- But, greater spatial concentration actually made search less efficient. Spatial concentration meant that individual targets were harder to distinguish from surrounding information, even if surrounded by other targets.
- High visual clutter had a similar effect. Increased clutter meant that there was more task-irrelevant information to be filtered, making the task more difficult overall.
Theme 2: Stable contrast highlighting confers substantial benefits
- Colour was very effective due to its strong and stable contrast, leading to more efficient visual search strategies.
- The ineffectiveness of Bold was attributed to its lack of contrast, suggesting that font weight alone is not sufficient for meeting the contrast threshold necessary to aid visual text search.
- While Flicker provided benefits to participants, it was less effective than Colour. This is likely attributed to flaws in its fundamental design, which constrained the benefits of sufficient contrast.
Theme 3: Flicker both benefits and decrements visual text search
- Flicker was found to be a very eye-catching highlight technique, promoting external attention capture to target letters.
- But, the oscillatory or breathing effect of Flicker also made information surrounding a specific target letter more distracting.
- Flicker placed more mental demands on participants to suppress its attention-grabbing effects on other target letters present.
Key Takeaways
What we learned about cluttered visual text search and how to improve it using highlighting techniques.
Text highlighting can help visual text search but clutter and information presentation have serious negative effects.
Visual clutter overwhelms users and presenting too much important information at once can contribute to it. Techniques such as Colour and Flicker are very beneficial for directing users across cluttered text as they distinguish important textual information from surrounding text. But they are most beneficial for different scenarios:
- When important information needs to be salient but non-distracting (e.g., definitions), this is best done through stable highlighting with sufficient contrast (i.e., Colour).
- When attention needs to be drawn to a piece of information immediately (e.g., directions), fluctuating contrast (i.e., Flicker) strongly draws attention.
Sufficient contrast is necessary to overcome the negative effects of clutter.
We found that a certain threshold of contrast is required to support visual text search in both a cluttered and non-cluttered context. Colour and Flicker employed a yellow colour as part of their design, this made distinguishing target letters much easier for participants. On the other hand, Bold provided very marginal benefits from using no highlight, indicating that colour may be the best way to achieve this contrast threshold while retaining legibility and stylistic consistency.
Designers should leverage colour as their foremost method for directing readers to important information in VR. Future research should look at how combining other features of text (e.g., font weight, size, animations) with colour and further improve outcomes.
Flicker is a complicated highlighting technique which seems best for a specific scenario.
It was shown that Flicker improved visual search across our measures, but less so than Colour. Thematic analysis revealed why: it's contrast-fluctuating design made target letters too salient, leading to distraction and increased mental effort. The apparent primary benefit of Flicker would then be to draw reader attention to immediately important information presented in isolation, such as warnings.
Flicker-esque techniques may be very beneficial in very active situations (e.g., a heavy action sequence in a VR video game) to draw user attention to important information. More research is needed to explore how highlighting techniques can be useful in these more engaged contexts.
Visual clutter and target frequency are symbiotic.
Our results demonstrated that visual clutter has a severe affect on task performance, as has been found in other contexts. Additionally, we also saw that increased target frequency negatively affects users. This can be translated as having too much important information presented at once. In this case, even the important information contributes to visual clutter. Hence, extra care needs to be taken when deciding how to present important information in text.
Designers should consider presenting important information in text sparsely to prevent adding to visual text clutter. Future research could explore how best to implement this so as to balance readability, convenience, and effectiveness.
Our study had limitations and would have benefited from a more realistic scenario.
The task we used consisted of counting target letters. This was done in response to the time constraints for carrying out study. It would be beneficial for future research to explore highlighting techniques using real passages or textual information to better replicate real scenarios in VR.
Moreover, a dimension that was lacking from this study was background clutter. Our VR environment consisted of a static room. VR applications often immerse users in very dynamic environments with movement and variations of colour and shapes. Future research needs to consider this dimension to better understand the benefits of highlighting techniques.